
This article will demonstrate how to enable and configure Diagnostic logging from all storage services within the Azure Storage Account – Blob, Queue, Table, and File into your Microsoft Sentinel workspace at scale, allowing you to continuously monitor activity in all your instances and detect malicious activity in your organization.
A common theme in cloud environments is enforcing organizational standards and adopting cloud governance since day one. And this is very important since it will give you the ability to define policies, processes, and procedures. These policies then dictate what can be done and verify that what does exist is correct. An excellent service from Microsoft called Azure Policy is a great way to make that happen and take proactive action.
Table of Contents
Introduction
Azure Policy is a service in Azure that you use to create, assign, and manage policies. These policies enforce different rules and effects over your resources, so those resources stay compliant with your corporate standards and service level agreements. Azure Policy meets this need by continuously evaluating your resources for non-compliance with assigned policies.
Organizations implementing Microsoft Sentinel as their Security Information and Event Management (SIEM), Security Orchestration, Automation, and Response (SOAR), and platform solution require comprehensive logging and monitoring of Azure resources. When you have critical applications and business processes that rely on Azure Storage, you want to monitor those resources for their availability, performance, and operation—but more importantly, you need to detect and investigate potential security threats and malicious activities.

Azure Storage diagnostic settings allow you to stream platform logs and metrics to various destinations. In this article, we’ll focus on streaming these logs to a Log Analytics workspace that’s connected to Microsoft Sentinel, enabling you to continuously monitor activity across all your storage accounts and detect malicious activity in your organization.
The Problem: Gaps in Built-in Azure Policies
At the time of this writing, Azure does not provide a comprehensive and flexible built-in policy to enable and configure diagnostic settings for each Azure Storage service under a storage account to a Log Analytics workspace. This is a significant gap for security operations teams.
The existing built-in policy “Configure diagnostic settings for Storage Accounts to Log Analytics workspace” (Policy ID: 59759c62-9a22-4cdf-ae64-074495983fef) only enables:
- Metrics (Transaction) for the top-level storage account resource
- Does NOT collect logs for individual storage services (Blob, File, Queue, Table)
- Does NOT capture critical audit logs like StorageRead, StorageWrite, and StorageDelete
To cover all storage services within an Azure storage account, including the top-level storage account resource, you need to assign the five built-in individual policies created by Microsoft to address each service:
1. Configure diagnostic settings for Storage Accounts to Log Analytics workspace
2. Configure diagnostic settings for Blob Services to Log Analytics workspace
3. Configure diagnostic settings for File Services to Log Analytics workspace
4. Configure diagnostic settings for Queue Services to Log Analytics workspace
5. Configure diagnostic settings for Table Services to Log Analytics workspace

Furthermore, those built-in policies do not support flexible log collection for StorageRead, StorageWrite, and StorageDelete activities across storage services. They include a parameter option to enable true or disable false audit logs and metrics (transaction). For example, you can’t stream and ingest only StorageWrite and StorageDelete, and filter out StorageRead from the audit logs. This approach creates management overhead and increases policy governance ingestion costs and complexity.

What About Data Collection Rules (DCRs)?
Microsoft recently announced in public preview the ability to use Data Collection Rules (DCRs) to collect and export platform metrics from Azure resources, including storage accounts.
Platform metrics are automatically collected from Azure resources and sent to Azure Monitor Metrics. The following figure shows the process of using a DCR to send this data to a Log Analytics workspace for analysis using log queries. This replaces the current method of using diagnostic settings to perform this function.
When the DCR is created, it specifies the workspace and table where the data should be sent. The DCR also includes a transformation that ensures the data is in the correct format for the target table. The DCR is then associated with the resource from which the platform metrics are collected.
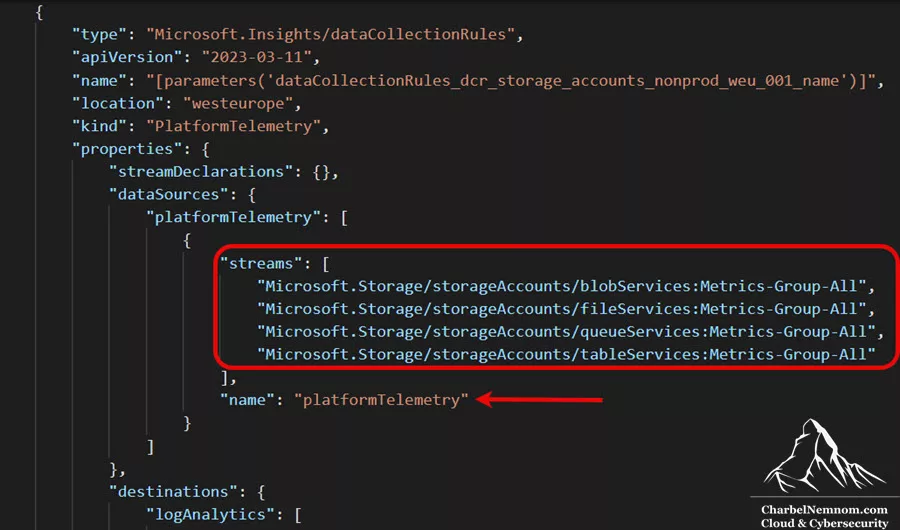
However, DCRs currently have significant limitations:
1. Metrics Only: DCRs only support exporting metrics (Transaction) and NOT audit logs for StorageRead, StorageWrite, and StorageDelete activities for each storage service.
2. Regional Restrictions: Resources must be in one of the following regions:
- Australia East
- Central US
- CentralUsEuap
- South Central US
- East US
- East US 2
- Eastus2Euap
- West US
- West US 2
- North Europe
- West Europe
- UK South
In Microsoft Sentinel security monitoring, audit logs are essential for detecting unauthorized access, data exfiltration, and compliance violations. Therefore, DCRs are not a viable solution for comprehensive security monitoring at this time.
The Solution: Unified Custom Azure Policy
The custom Azure Policy presented in this article addresses all these limitations by providing:
✅ Single Policy Definition covering all five storage services
✅ Complete Audit Logging for StorageRead, StorageWrite, and StorageDelete
✅ Transaction Metrics for performance monitoring
✅ Flexible Service Selection via parameters
✅ Automated Remediation for existing and new storage resources
✅ Direct Integration with Microsoft Sentinel via Log Analytics workspace
This unified approach simplifies policy management while ensuring comprehensive security monitoring across your Azure Storage infrastructure.
Understanding Azure Storage Diagnostic Settings
A diagnostic setting specifies a list of categories of platform logs and/or metrics that you want to collect from a resource, and one or more destinations to which you would stream them.
Available Logs and Metrics
The unified custom Azure Policy supports the following logs and metrics that are available for diagnostic settings:
Storage Account (Top Level):
- Metrics: Transaction
Blob Service:
- Logs: StorageRead | StorageWrite | StorageDelete
- Metrics: Transaction
File Service:
- Logs: StorageRead | StorageWrite | StorageDelete
- Metrics: Transaction
Table Service:
- Logs: StorageRead | StorageWrite | StorageDelete
- Metrics: Transaction
Queue Service:
- Logs: StorageRead | StorageWrite | StorageDelete
- Metrics: Transaction
Microsoft Sentinel Integration
Microsoft Sentinel includes a dedicated data connector for Azure Storage accounts that lets you stream diagnostics logs into your Microsoft Sentinel workspace. This connector enables:
- Real-time monitoring of storage account activities
- Detection of suspicious access patterns
- Investigation of data exfiltration attempts
- Compliance reporting for audit requirements
- Correlation with other security events across your Azure environment
However, the data connector in the Content hub leverages the five built-in Azure policies we mentioned above, and you need to assign each policy individually to collect the desired storage service logs and metrics.

As mentioned, those built-in policies lack the flexibility to collect the desired audit logs, such as StorageRead, StorageWrite, and StorageDelete.
Why Diagnostic Settings Instead of Activity Logs?
A common question from security teams is: “Why enable diagnostic settings for each storage service when Azure Activity Logs ingestion is already available for free?” Understanding this distinction is critical for effective threat detection.
Control Plane vs. Data Plane Monitoring
Azure Activity Logs capture *control plane* operations, those are management actions on the storage account resource itself, like:
- Creating or deleting storage accounts
- Changing firewall rules or encryption settings
- Modifying access keys or replication settings
- RBAC role assignments
Diagnostic Settings capture *data plane* operations, which are actual data access within each storage service:
- Individual blob/file/table/queue read, write, and delete operations
- Caller identity and IP address for each operation
- Authentication methods (Shared Key, SAS, OAuth, Anonymous)
- Request/response sizes and data transfer volumes
- Success/failure status codes and performance metrics
Why does this matter for security investigations? Consider the following real-world security scenarios:
* Scenario 1: Data Exfiltration — “Did someone download 100GB of sensitive data from blob storage last night?”
- Activity Logs:❌ Cannot detect this—no data operation logging
- Diagnostic Settings:✅ Shows all GetBlob operations with sizes, caller IPs, and timestamps
* Scenario 2: Ransomware Attack — “Did malware delete thousands of files from file shares?”
- Activity Logs:❌ Only shows if the storage account itself was deleted/modified
- Diagnostic Settings:✅ Shows every DeleteFile operation with the caller identity and timing
* Scenario 3: Unauthorized Access — “Is anyone accessing blobs anonymously from external IPs?”
- Activity Logs:❌ Doesn’t track individual blob access attempts
- Diagnostic Settings:✅ Shows authentication type, caller IP, and access patterns for every request
* Scenario 4: Insider Threat — “Which user accessed specific confidential files last week?”
- Activity Logs:❌ No file-level access tracking
- Diagnostic Settings:✅ Complete audit trail of who accessed what, when, and from where
Important: Activity Logs are collected automatically, but diagnostic settings for storage services must be explicitly enabled. This is exactly what the custom Azure Policy in this article automates at scale, ensuring that *data access operations* where most security incidents occur are properly monitored and ingested into Microsoft Sentinel. For comprehensive security monitoring in Microsoft Sentinel, you need both Activity Logs and Diagnostic Settings.
Prerequisites
To follow this article, you need to have the following:
1) Azure subscription – If you don’t have an Azure subscription, you can create one here for free.
2) Log Analytics workspace – To create a new workspace, follow the instructions to create a Log Analytics workspace.
3) Enable Microsoft Sentinel at no additional cost on an Azure Monitor Log Analytics workspace for the first 31 days; follow the quick onboarding process. Once Microsoft Sentinel is enabled on your Azure Monitor Log Analytics workspace, every GB of data ingested into the workspace can be retained at no charge for 90 days.
4) One or more Azure storage accounts deployed in your subscription. To create a general-purpose v2 storage account, you can follow the instructions described here.
5) Appropriate permissions to create and assign Azure Policy definitions at your desired scope (Management Group, Subscription, or Resource Group level).
Note: You can enable and configure diagnostic settings by using the Azure Portal, PowerShell, the Azure CLI, Terraform, Bicep, an Azure Resource Manager (ARM) template, or Azure Policy (the scope of this article).
Create Custom Policy Definition
A quick overview of Azure Policy effects. Each policy definition that you create in Azure Policy has a single effect. That effect determines what happens when the policy rule is evaluated to match. The effects differ depending on whether the resource is new, updated, or existing.
In this example, we need to set the diagnostic settings to stream to a Log Analytics workspace for newly deployed Azure storage accounts, as well as for existing resources in our environment. For this to work, we need to use the “DeployIfNotExists” policy effect. To understand how the Azure Policy effect works with the “DeployIfNotExists” policy definition, please check the official Microsoft documentation.
The policy definition below evaluates all storage accounts to determine whether Diagnostic Settings is enabled to stream to the specified Log Analytics workspace. If not, then a deployment to enable diagnostic settings is executed for the selected logs and metrics and for the selected storage service (Blob, Queue, Table, and File).
Policy Definition Overview
The custom policy definition includes the following key components:
* Policy Mode: `All` – Evaluates all resource types
* Policy Rule Conditions:
- Resource type equals
Microsoft.Storage/storageAccounts - Resource location matches the specified parameter
- Diagnostic settings not already configured for the specified workspace
* Role Definitions Required:
-
749f88d5-cbae-40b8-bcfc-e573ddc772fa– Monitoring Contributor -
92aaf0da-9dab-42b6-94a3-d43ce8d16293– Log Analytics Contributor
These RBAC roles are required to enable diagnostic settings and configure Log Analytics workspace integration.
* Existence Condition:
The existenceCondition option in the policy is crucial for Azure storage accounts that already have metrics and logs enabled. If this condition evaluates to true, the policy definition will skip the deployment defined in the “DeployIfNotExists” section, preventing unnecessary reconfigurations.
* Deployment Resources: The policy deploys and configures five conditional resources:
1. Blob Services diagnostic settings
2. File Services diagnostic settings
3. Table Services diagnostic settings
4. Queue Services diagnostic settings
5. Storage Account (top-level) diagnostic settings
Each resource is conditionally deployed based on the servicesToDeploy parameter, giving you flexibility to enable diagnostics for specific services only.
Creating the Policy Definition
Open the Azure Portal, click “All services” and then search for “Policy” and then click on “Definitions” → “+ Policy definition“.
For the “Definition location“, select the scope by clicking the ellipsis […] and selecting either a management group, a subscription, or a resource group. This determines the scope where the policy definition will be available.
In the “Name” field, give a descriptive name for the policy definition, such as: Configure diagnostic settings for Azure Storage accounts to Sentinel.
Enter a Description, such as: Configure diagnostic settings for Azure Storage accounts (including Blob, File, Table, and Queue services) to stream resource logs and metrics to a Log Analytics workspace connected to Microsoft Sentinel whenever a storage account is created or updated and lacks these diagnostic settings.
In the “Category” section, select “Storage” or create a custom category like “Microsoft Sentinel” to organize your different policy definitions.
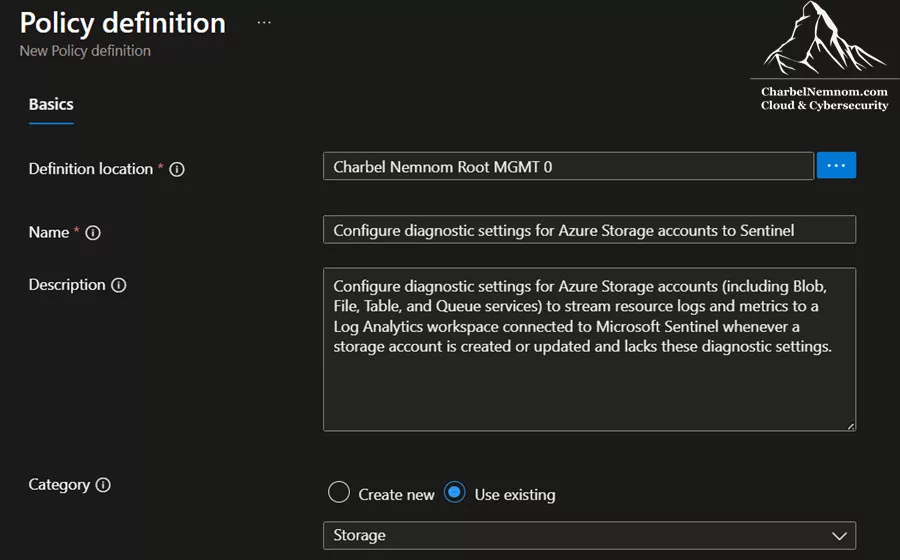
Complete Policy Definition JSON
Under the “POLICY RULE” section, paste the following policy definition in JSON format and then click “Save“.
{
"mode": "All",
"policyRule": {
"if": {
"allOf": [
{
"field": "type",
"equals": "Microsoft.Storage/storageAccounts"
},
{
"field": "location",
"equals": "[parameters('Location')]"
}
]
},
"then": {
"effect": "[parameters('effect')]",
"details": {
"type": "Microsoft.Insights/diagnosticSettings",
"roleDefinitionIds": [
"/providers/Microsoft.Authorization/roleDefinitions/749f88d5-cbae-40b8-bcfc-e573ddc772fa",
"/providers/Microsoft.Authorization/roleDefinitions/92aaf0da-9dab-42b6-94a3-d43ce8d16293"
],
"existenceCondition": {
"allOf": [
{
"field": "Microsoft.Insights/diagnosticSettings/metrics.enabled",
"equals": "True"
},
{
"field": "Microsoft.Insights/diagnosticSettings/logs.enabled",
"equals": "True"
},
{
"field": "Microsoft.Insights/diagnosticSettings/workspaceId",
"equals": "[parameters('logAnalytics')]"
}
]
},
"deployment": {
"properties": {
"mode": "incremental",
"template": {
"$schema": "http://schema.management.azure.com/schemas/2015-01-01/deploymentTemplate.json#",
"contentVersion": "1.0.0.0",
"parameters": {
"servicesToDeploy": {
"type": "array"
},
"diagnosticsSettingNameToUse": {
"type": "string"
},
"resourceName": {
"type": "string"
},
"logAnalytics": {
"type": "string"
},
"location": {
"type": "string"
},
"Transaction": {
"type": "bool"
},
"StorageRead": {
"type": "bool"
},
"StorageWrite": {
"type": "bool"
},
"StorageDelete": {
"type": "bool"
}
},
"variables": {},
"resources": [
{
"condition": "[contains(parameters('servicesToDeploy'), 'blobServices')]",
"type": "Microsoft.Storage/storageAccounts/blobServices/providers/diagnosticSettings",
"apiVersion": "2017-05-01-preview",
"name": "[concat(parameters('resourceName'), '/default/', 'Microsoft.Insights/', parameters('diagnosticsSettingNameToUse'))]",
"location": "[parameters('location')]",
"dependsOn": [],
"properties": {
"workspaceId": "[parameters('logAnalytics')]",
"metrics": [
{
"category": "Transaction",
"enabled": "[parameters('Transaction')]"
}
],
"logs": [
{
"category": "StorageRead",
"enabled": "[parameters('StorageRead')]"
},
{
"category": "StorageWrite",
"enabled": "[parameters('StorageWrite')]"
},
{
"category": "StorageDelete",
"enabled": "[parameters('StorageDelete')]"
}
]
}
},
{
"condition": "[contains(parameters('servicesToDeploy'), 'fileServices')]",
"type": "Microsoft.Storage/storageAccounts/fileServices/providers/diagnosticSettings",
"apiVersion": "2017-05-01-preview",
"name": "[concat(parameters('resourceName'), '/default/', 'Microsoft.Insights/', parameters('diagnosticsSettingNameToUse'))]",
"location": "[parameters('location')]",
"dependsOn": [],
"properties": {
"workspaceId": "[parameters('logAnalytics')]",
"metrics": [
{
"category": "Transaction",
"enabled": "[parameters('Transaction')]"
}
],
"logs": [
{
"category": "StorageRead",
"enabled": "[parameters('StorageRead')]"
},
{
"category": "StorageWrite",
"enabled": "[parameters('StorageWrite')]"
},
{
"category": "StorageDelete",
"enabled": "[parameters('StorageDelete')]"
}
]
}
},
{
"condition": "[contains(parameters('servicesToDeploy'), 'tableServices')]",
"type": "Microsoft.Storage/storageAccounts/tableServices/providers/diagnosticSettings",
"apiVersion": "2017-05-01-preview",
"name": "[concat(parameters('resourceName'), '/default/', 'Microsoft.Insights/', parameters('diagnosticsSettingNameToUse'))]",
"location": "[parameters('location')]",
"dependsOn": [],
"properties": {
"workspaceId": "[parameters('logAnalytics')]",
"metrics": [
{
"category": "Transaction",
"enabled": "[parameters('Transaction')]"
}
],
"logs": [
{
"category": "StorageRead",
"enabled": "[parameters('StorageRead')]"
},
{
"category": "StorageWrite",
"enabled": "[parameters('StorageWrite')]"
},
{
"category": "StorageDelete",
"enabled": "[parameters('StorageDelete')]"
}
]
}
},
{
"condition": "[contains(parameters('servicesToDeploy'), 'queueServices')]",
"type": "Microsoft.Storage/storageAccounts/queueServices/providers/diagnosticSettings",
"apiVersion": "2017-05-01-preview",
"name": "[concat(parameters('resourceName'), '/default/', 'Microsoft.Insights/', parameters('diagnosticsSettingNameToUse'))]",
"location": "[parameters('location')]",
"dependsOn": [],
"properties": {
"workspaceId": "[parameters('logAnalytics')]",
"metrics": [
{
"category": "Transaction",
"enabled": "[parameters('Transaction')]"
}
],
"logs": [
{
"category": "StorageRead",
"enabled": "[parameters('StorageRead')]"
},
{
"category": "StorageWrite",
"enabled": "[parameters('StorageWrite')]"
},
{
"category": "StorageDelete",
"enabled": "[parameters('StorageDelete')]"
}
]
}
},
{
"condition": "[contains(parameters('servicesToDeploy'), 'storageAccounts')]",
"type": "Microsoft.Storage/storageAccounts/providers/diagnosticSettings",
"apiVersion": "2017-05-01-preview",
"name": "[concat(parameters('resourceName'), '/', 'Microsoft.Insights/', parameters('diagnosticsSettingNameToUse'))]",
"location": "[parameters('location')]",
"dependsOn": [],
"properties": {
"workspaceId": "[parameters('logAnalytics')]",
"metrics": [
{
"category": "Transaction",
"enabled": "[parameters('Transaction')]"
}
]
}
}
],
"outputs": {}
},
"parameters": {
"diagnosticsSettingNameToUse": {
"value": "[parameters('diagnosticsSettingNameToUse')]"
},
"logAnalytics": {
"value": "[parameters('logAnalytics')]"
},
"Location": {
"value": "[field('location')]"
},
"resourceName": {
"value": "[field('name')]"
},
"Transaction": {
"value": "[parameters('Transaction')]"
},
"StorageDelete": {
"value": "[parameters('StorageDelete')]"
},
"StorageWrite": {
"value": "[parameters('StorageWrite')]"
},
"StorageRead": {
"value": "[parameters('StorageRead')]"
},
"servicesToDeploy": {
"value": "[parameters('servicesToDeploy')]"
}
}
}
}
}
}
},
"parameters": {
"logAnalytics": {
"type": "String",
"metadata": {
"displayName": "Log Analytics workspace",
"description": "Select Log Analytics workspace from the dropdown list. If this workspace is outside of the scope of the assignment you must manually grant 'Log Analytics Contributor' permissions (or similar) to the policy assignment's principal ID.",
"strongType": "omsWorkspace",
"assignPermissions": true
}
},
"Location": {
"type": "String",
"metadata": {
"displayName": "Resource Location",
"description": "Resource Location must be the same as the Event Hub Location",
"strongType": "location"
}
},
"servicesToDeploy": {
"type": "Array",
"metadata": {
"displayName": "Storage services to deploy",
"description": "List of Storage services to deploy"
},
"allowedValues": [
"storageAccounts",
"blobServices",
"fileServices",
"tableServices",
"queueServices"
],
"defaultValue": [
"storageAccounts",
"blobServices",
"fileServices",
"tableServices",
"queueServices"
]
},
"diagnosticsSettingNameToUse": {
"type": "String",
"metadata": {
"displayName": "Setting name",
"description": "The name of the diagnostic settings."
},
"defaultValue": "diagStorageSetByAzPolicyToLAW"
},
"effect": {
"type": "String",
"metadata": {
"displayName": "Effect",
"description": "Enable or disable the execution of the policy"
},
"allowedValues": [
"DeployIfNotExists",
"AuditIfNotExists",
"Disabled"
],
"defaultValue": "DeployIfNotExists"
},
"StorageDelete": {
"type": "Boolean",
"metadata": {
"displayName": "StorageDelete - Enabled",
"description": "Whether to stream StorageDelete logs to the Log Analytics workspace - True or False"
},
"allowedValues": [
true,
false
],
"defaultValue": true
},
"StorageWrite": {
"type": "Boolean",
"metadata": {
"displayName": "StorageWrite - Enabled",
"description": "Whether to stream StorageWrite logs to the Log Analytics workspace - True or False"
},
"allowedValues": [
true,
false
],
"defaultValue": true
},
"StorageRead": {
"type": "Boolean",
"metadata": {
"displayName": "StorageRead - Enabled",
"description": "Whether to stream StorageRead logs to the Log Analytics workspace - True or False"
},
"allowedValues": [
true,
false
],
"defaultValue": true
},
"Transaction": {
"type": "Boolean",
"metadata": {
"displayName": "Transaction - Enabled",
"description": "Whether to stream Transaction logs to the Log Analytics workspace - True or False"
},
"allowedValues": [
true,
false
],
"defaultValue": true
}
}
}Policy Parameters Explained
The policy definition includes several customizable parameters:
* logAnalytics: The Resource ID of your Log Analytics workspace (connected to Microsoft Sentinel). This parameter uses `strongType: “omsWorkspace”` for easy selection from the Azure Portal dropdown.
* Location: The Azure region where your storage accounts are deployed. This ensures you only target storage accounts in specific regions.
* servicesToDeploy: An array parameter that allows you to select which storage services should have diagnostic settings enabled. By default, all five services are selected.
* diagnosticsSettingNameToUse: The name for the diagnostic settings resource. Default is `diagStorageSetByAzPolicyToLAW`.
* effect: Controls the policy behavior. Options include:
-
DeployIfNotExists(default): Automatically deploys diagnostic settings for non-compliant resources -
AuditIfNotExists: Only identifies non-compliant resources without taking action -
Disabled: Disables the policy without deleting the assignment
* StorageDelete, StorageWrite, StorageRead: Boolean parameters to enable/disable specific log categories. These are crucial for security monitoring in Sentinel.
* Transaction: Boolean parameter to enable/disable transaction metrics collection. The transaction (metrics) are optional from a security monitoring point of view.
Here is the distinct difference between storage metrics (transaction) and audit logs, so you can choose wisely.
Metrics (Transaction)
- What they are: Numerical values captured at regular intervals, such as transaction count, ingress/egress, and latency.
- Purpose: To monitor the real-time health, performance, and capacity of the storage account. They are used for performance tuning and quickly identifying bottlenecks.
-
How to view: Through the Metrics explorer in Azure Monitor or the Storage account’s Overview page. For more in-depth analysis, you need to export the metrics logs to a Log Analytics workspace / Sentinel as described in this article, so you can query them using the
AzureMetrics(Azure Storage) table.
AzureMetrics
| where ResourceProvider == "MICROSOFT.STORAGE"
Audit Logs
- What they are: Records of control-plane and security-related activities, such as creating, deleting, or modifying resources, or user sign-in attempts.
- Purpose: To meet compliance requirements, track who performed specific actions, and for security analysis.
- How to view: Through the Activity log in Azure Monitor. For more in-depth analysis, you need to export the audit logs to a Log Analytics workspace / Sentinel as described in this article, so you can query them using one of the following tables:
StorageBlobLogs,StorageQueueLogs,StorageTableLogs, andStorageFileLogs.
Assign Custom Policy Definition
To assign the new custom policy definition, take the following steps:
Note: If you want to automate the deployment and assignment of Azure Policies via Azure DevOps instead of using the Azure Portal, then please check the following step-by-step guide.
Switch to the Azure Portal, click “All services” and then search for “Policy“, and then click on “Assignments“. An assignment is a policy that has been assigned to take place within a specific scope.
Select “Assign policy” from the top of the “Policy | Assignments” page.
On the “Assign Policy” page, select the *Scope* by clicking the ellipsis […] and selecting either a management group or subscription. You can optionally select a resource group if you want. A scope determines what resources or grouping of resources the policy assignment gets enforced on. Then click *Select* at the bottom of the Scope page.
Select the *Policy definition* ellipsis […] to open the list of available definitions. Choose the custom policy that we created in the previous step: Configure diagnostic settings for Azure Storage accounts to Sentinel.
The *Policy enforcement* is *Enabled* by default. Click *Next* to continue.
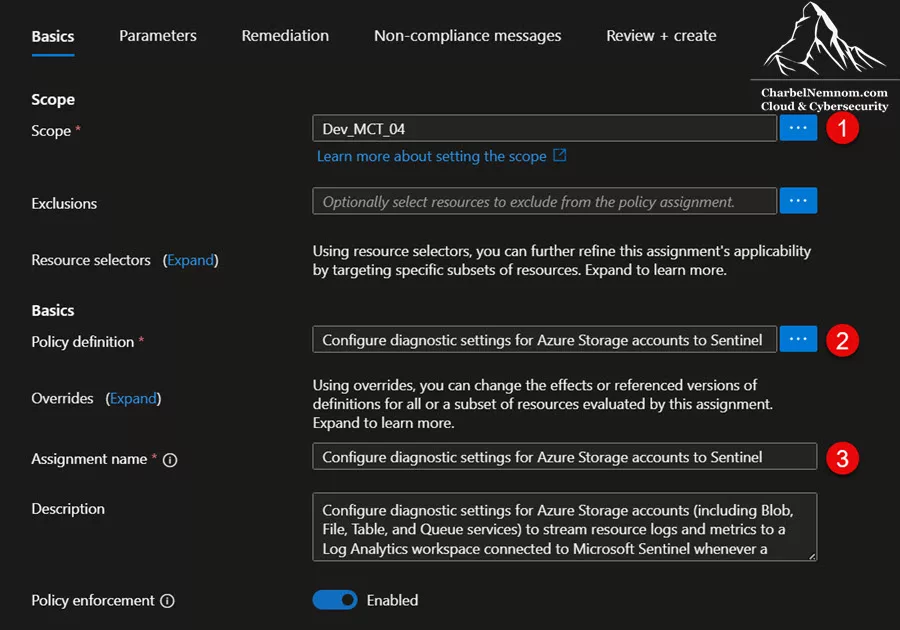
Configure Policy Parameters
On the *Parameters* page, deselect Only show parameters that need input or review and specify the following individual parameters for this policy assignment:
* Log Analytics workspace: Select your Microsoft Sentinel workspace from the dropdown list. If your workspace is outside the scope of the assignment, you must manually grant ‘Log Analytics Contributor’ permissions to the policy assignment’s managed identity.
* Resource Location: Select the Azure region where your storage accounts are deployed. You may need to create multiple policy assignments if you have storage accounts in different regions.
* Storage services to deploy: By default, all 5 services are selected:
- storageAccounts
- blobServices
- fileServices
- tableServices
- queueServices
You can deselect any services you don’t want to monitor.
* Setting name: The diagnostic settings default name is diagStorageSetByAzPolicyToLA. You can customize this if needed.
* Effect: The default value is set to “DeployIfNotExists“. You can disable the effect of this policy later by setting it to “Disabled” or use “AuditIfNotExists” to only identify non-compliant resources.
* StorageDelete – Enabled: Default is true. Enable the collection of delete operation logs (critical for security investigations).
* StorageWrite – Enabled: Default is true. Enable the collection of write operation logs (essential for data integrity monitoring).
* StorageRead – Enabled: Default is true. Enable the collection of read operation logs (important for access pattern analysis).
* Transaction – Enable: Default is true. Enable the collection of transaction metrics (useful for performance monitoring).

Click *Next* to continue.
Configure Remediation
On the *Remediation* page, by default, “Create a Managed Identity” with *system-assigned* is selected for you. This is required because existing resources can be updated via a remediation task after the policy is assigned.
Policies with the “deployIfNotExists” effect type need the ability to modify resources and configure settings on existing resources. To do this, a managed identity will be created automatically for each policy assignment. This identity will be given the following permissions on the scope you selected earlier:
-
Monitoring Contributor(749f88d5-cbae-40b8-bcfc-e573ddc772fa) -
Log Analytics Contributor(92aaf0da-9dab-42b6-94a3-d43ce8d16293)
Choose the default location for the “System-assigned identity location“. This should be a region where Azure Policy managed identities are supported. It’s recommended that a managed identity be created in a region that is different than your source region because in scenarios where a disaster strikes, your source region, and even more, Identity will go down. For example, if your resources are deployed in West Europe, you’ll choose the System-assigned identity location in North Europe.
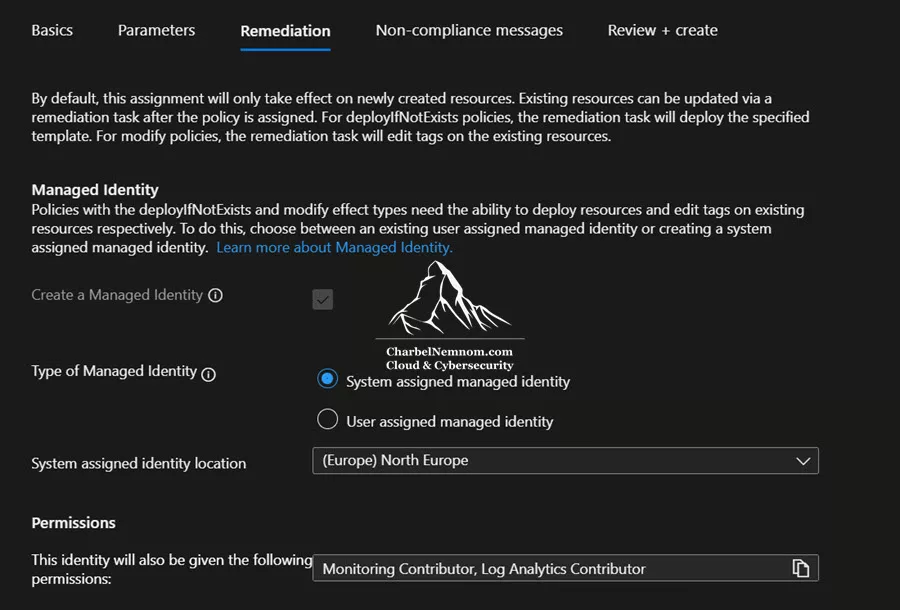
Click *Next* to continue.
Configure Non-Compliance Message
On the *Non-compliance message* page, set a descriptive message that will be shown for non-compliant resources: `Diagnostic settings for Storage accounts must be enabled and configured to stream logs to Microsoft Sentinel for security monitoring and threat detection`.
This message will appear in compliance reports and help your Cloud teams understand why the resource is flagged as non-compliant.
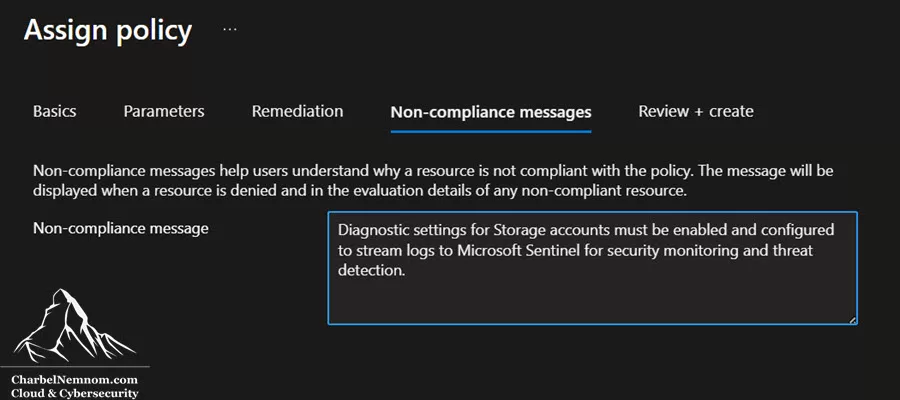
Click “Review + create” to review your configuration. Finally, click “Create” to create the policy assignment.
Verify Diagnostic Settings for Storage Accounts
To verify that the custom policy is deployed successfully, you need to wait for at least *30 minutes* after the policy assignment is created. The policy won’t be triggered immediately—this is by design to prevent excessive evaluation cycles.
Trigger Policy Compliance Scan Manually
To trigger the policy compliance scan immediately, open the *Azure Cloud Shell* and run the following PowerShell command:
$job = Start-AzPolicyComplianceScan -AsJob
$job | Format-Table -AutoSize
The scan job will run in the background.

Note: If you want to check Azure Policy compliance status and remediate non-compliant resources via Azure DevOps Pipelines, then please check the following step-by-step guide.
Create Remediation Task for Existing Resources
Behind the scenes, Azure Policy will create a *Remediation task* to configure diagnostic settings on existing storage accounts. To remediate existing resources:
1. Navigate to *Policy* → *Remediation* in the Azure Portal.
2. Select the policy assignment you created (i.e., Configure diagnostic settings for Azure Storage accounts to Sentinel).
3. Click on the “Create Remediation Task” button if it has not already been created.
4. If the remediation task has been created, click *Remediate*, as shown in the figure below.
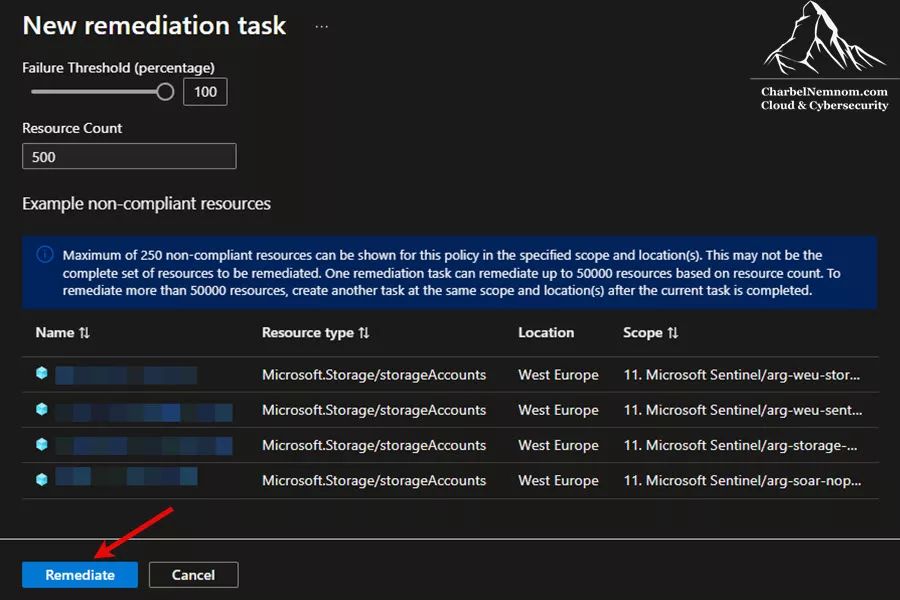
Please note that during an evaluation cycle, the policy definition with a “DeployIfNotExists” effect that matches resources is marked as *non-compliant only*—no action is taken on that resource automatically. The remediation task must be created to apply the configuration to existing storage resources. For new storage accounts created in the future, the policy will automatically remediate and configure the diagnostics settings.
Check Remediation Task Status
Open the Azure Portal, navigate to *Policy* → *Remediation*, and select the *Remediation tasks* tab.
Check the status of the remediation task. Once the remediation is complete, you’ll see the number of resources that were remediated. In this example, we remediated (4 out of 4).

Verify Storage Account Diagnostic Settings
Navigate to one of your Storage accounts in the Azure Portal. Under *Monitoring* → *Diagnostic settings*, you should see that the “Diagnostics status” is *Enabled* for all storage services you selected in the policy parameters.

Click any resource type or storage service to view its diagnostic settings. You should see that diagnostic settings are configured to send audit logs and/or metrics to your *Log Analytics workspace/Sentinel*.

Validate Data in Microsoft Sentinel
After diagnostic settings are enabled, logs will start flowing to your Log Analytics workspace. To verify the data in Microsoft Sentinel:
Check Data Ingestion
Navigate to your *Microsoft Sentinel* workspace in the Azure Portal or in the Defender portal. Go to *Logs* or to the *Advanced hunting* and run the following KQL query to verify storage account logs are being ingested:
// Storage Account Blob Service Logs
StorageBlobLogs
| where TimeGenerated > ago(1h)
| summarize Count = count() by AccountName, OperationName
| order by Count desc

// Storage Account File Service Logs
StorageFileLogs
| where TimeGenerated > ago(1h)
| summarize Count = count() by AccountName, OperationName
| order by Count desc

// Storage Account Queue Service Logs
StorageQueueLogs
| where TimeGenerated > ago(1h)
| summarize Count = count() by AccountName, OperationName
| order by Count desc

// Storage Account Table Service Logs
StorageTableLogs
| where TimeGenerated > ago(1h)
| summarize Count = count() by AccountName, OperationName
| order by Count desc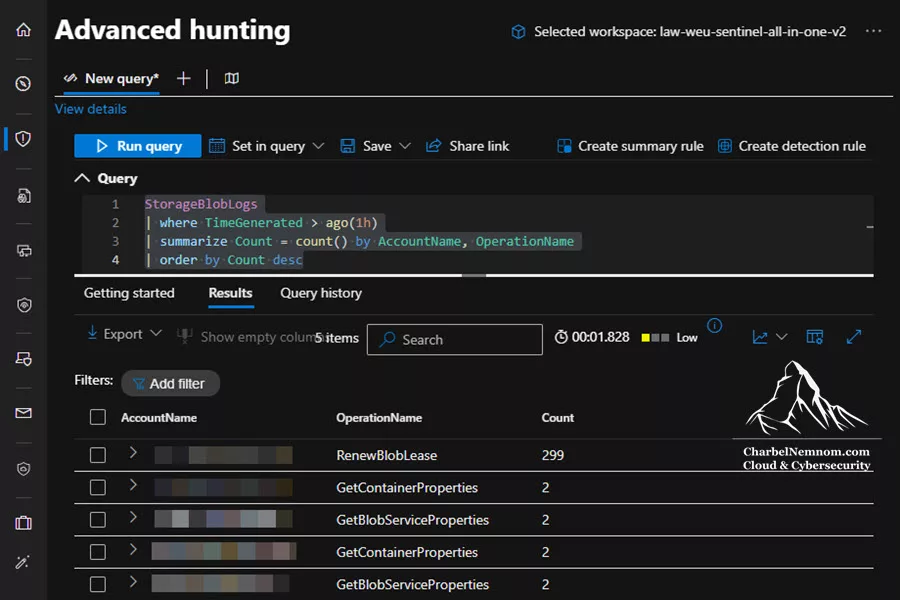
Enable Azure Storage Data Connector
In Microsoft Sentinel, enable the *Azure Storage* data connector. Through the Azure portal or the Defender portal:
1. Navigate to *Microsoft Sentinel* → *Content Hub*, then search for “Azure Storage” and install it if it’s not installed yet.
2. Navigate to *Microsoft Sentinel* → *Data connectors*, then search for “Azure Storage“.
3. Select the connector and click “Open connector page“.
4. The connector should show “Connected” status since diagnostic settings are automatically configured using Azure Policy.
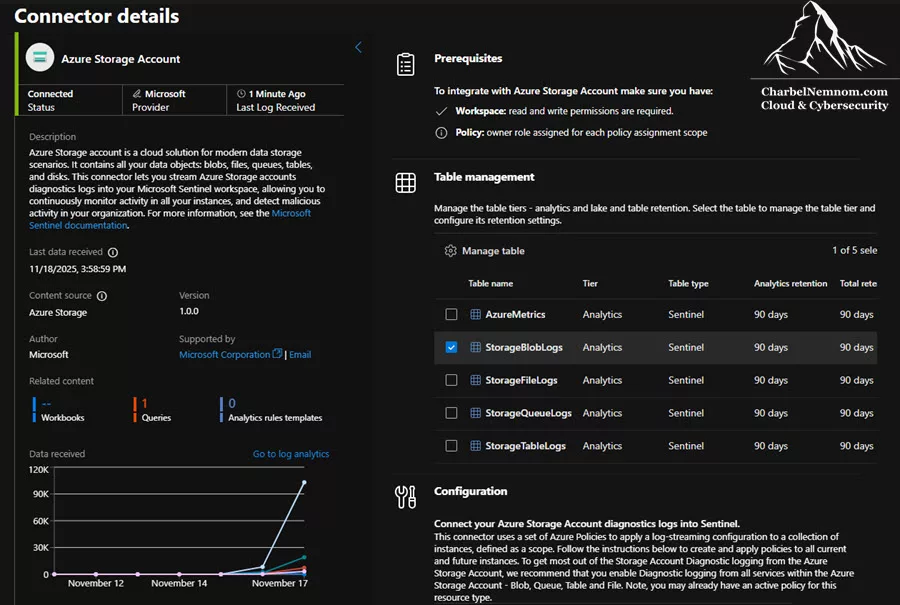
Create Analytics Rules
With logs flowing into Sentinel, you can now create *Analytics Rules* or *Custom detection rules* in the Defender portal to detect suspicious storage activities:
Example 1: Unusual Storage Delete Operations
StorageBlobLogs
| where OperationName == "DeleteBlob" or OperationName == "DeleteContainer"
| where TimeGenerated > ago(1h)
| summarize DeleteCount = count() by CallerIpAddress, AccountName, bin(TimeGenerated, 5m)
| where DeleteCount > 10
| project TimeGenerated, CallerIpAddress, AccountName, DeleteCount
Example 2: Anonymous Access Attempts
StorageBlobLogs
| where AuthenticationType == "Anonymous"
| where StatusCode != 200
| project TimeGenerated, AccountName, Uri, CallerIpAddress, StatusCode, StatusText
Example 3: Data Exfiltration Detection
StorageBlobLogs
| where OperationName == "GetBlob"
| summarize TotalBytes = sum(ResponseBodySize), RequestCount = count() by CallerIpAddress, AccountName, bin(TimeGenerated, 1h)
| where TotalBytes > 1073741824 // Greater than 1GB
| project TimeGenerated, CallerIpAddress, AccountName, TotalBytesGB = TotalBytes / 1073741824.0, RequestCount
You can also create custom *Workbooks* in Microsoft Sentinel to visualize storage account activities in one dashboard, such as:
- Storage account operation trends over time
- Top storage accounts by transaction count
- Failed authentication attempts
- Geographic distribution of access patterns
- Anomalous delete operations
That’s it—there you have it!
Wrapping Up
In this article, we demonstrated how to enable and configure diagnostic settings for Azure Storage accounts (including all individual services: Blob, File, Table, and Queue) to stream logs and metrics to Microsoft Sentinel using a *unified custom Azure Policy*.
Azure Storage accounts are often targeted in data exfiltration attacks, ransomware campaigns, and insider threat scenarios. By implementing this policy, you ensure:
- Complete visibility into all storage account activities across your Azure environment
- Early detection of suspicious access patterns and unauthorized data access
- Compliance readiness for regulations requiring audit logs (GDPR, HIPAA, PCI-DSS)
- Incident response capabilities with comprehensive audit trails
- Automated enforcement of security logging standards
Azure Policies are becoming increasingly popular, as they provide a wide range of management capabilities over Azure resources. Not only do they allow us to enforce policy rules to control Azure resources, but they can also enable us to automatically evaluate compliance and remediate non-compliant resources—making them essential for security operations at scale.
We hope you find this guide helpful in securing and monitoring your Azure Storage infrastructure with Microsoft Sentinel.
Remember, you can always support us in developing tools and creating content via Why Contribute? – Charbelnemnom.com Cloud & Cybersecurity
__
Thank you for reading our blog.
Please let us know in the comments section below if you have any questions or feedback.
-Charbel Nemnom-

Great blog post. Very thorough and explained gaps with the inbuilts and preview DRCs really well. Thanks!
Thank you so much, Richard — really appreciate your comment and feedback!
The Remediation page of the Assign Policy step is showing me “This policy does not support remediation tasks. Policies must have remediation support in order to create a remediation task.?
Hello Dean, Thanks for reaching out, hope you’re doing well!
Yes, this one is an easy fix.
The message that you shared means the policy’s effect isn’t set to a remediable one. Only
DeployIfNotExistsandModifyeffects support remediation tasks. The policy that I shared in the article here uses an Effect parameter, and the Remediation tab reads whatever you selected on the Parameters page. Your message shows it got set toAuditIfNotExists (or Disabled), which only flags non-compliant storage accounts and never deploys anything, so there’s nothing to remediate.The fix isn’t to create the task manually. Go back to the Parameters page and set Effect to
DeployIfNotExists(untick “Only show parameters that need input or review” so the dropdown shows). The Remediation tab will then offer the managed identity as expected, and you can finish the assignment and run the remediation task on your existing storage accounts.Just remember
DeployIfNotExistsauto-remediates only new resources, so you still create a remediation task once for existing ones (covered under “Create Remediation Task for Existing Resources”).Give that a try and let me know if it works for you. Hope this helps!