
Updated — 01/04/2025 — Starting 1 May 2025, Microsoft will begin billing for queries and search jobs on logs ingested into the Auxiliary Logs plan. Querying Auxiliary Logs will be charged $0.005 per GB of data scanned (US East), and Search jobs on Auxiliary Logs will incur a cost of $0.005 per GB of data scanned (US East) plus search results ingestion costs.
Updated — 28/02/2025 — Starting 1 April 2025, Auxiliary Logs will be generally available (GA). Ingestion billing will begin at $0.15 per GB (US East), and long-term retention billing will be at $0.02 per GB (US East).
Fortinet firewall logs, when ingested into Sentinel’s `CommonSecurityLog` table, are billed at the Analytics tier rates. For organizations with high log volumes, this can result in significant costs. To mitigate these costs, we could selectively route logs based on policy numbers to custom tables configured for the Basic or Auxiliary Tiers, which offers a lower cost structure.
This article explains the technical implementation, the logic behind the ingestion-time transformation for Fortinet Logs in Microsoft Sentinel to reduce costs, and the potential for further optimization with the Auxiliary log tier.
Table of Contents
The Cost Optimization Challenge
Managing log ingestion costs is a critical consideration for organizations using Microsoft Sentinel. High-volume data sources like Fortinet firewall logs can quickly inflate costs, especially when logs are ingested into the Analytics tier.
To address this challenge, we developed an ingestion-time transformation solution that leverages Fortinet policy-based routing to optimize costs. This approach reduces ingestion costs by routing specific Fortinet firewall logs to the Basic log tier based on their `DeviceEventCategory` and policy numbers while keeping other logs in the default `CommonSecurityLog` table.
As a side note, Auxiliary Logs in Microsoft Sentinel are ideal for high-volume security logs like network, firewall, and proxy logs, which are crucial for security investigations, hunting, or additional attack context.
Starting 1 April 2025, Auxiliary Logs will be generally available (GA). Ingestion billing will begin at $0.15 per GB (US East), and long-term retention billing will be at $0.02 per GB (US East). Microsoft will also start billing for queries and search jobs on logs ingested into the Auxiliary Logs plan. Querying Auxiliary Logs will be charged $0.005 per GB of data scanned (US East), and Search jobs on Auxiliary Logs will incur a cost of $0.005 per GB of data scanned (US East) plus search results ingestion costs.
Note: At the time of this writing, data transformations for the Auxiliary log are not supported yet, so we cannot route the logs to different custom tables as illustrated in this article. Stay Tuned!
Different Needs for Logs
Organizations have different needs for logs, so it’s strongly recommended when planning a Microsoft Sentinel deployment to classify the security data, which can be divided into two categories: primary data (hot) and secondary data (warm or cold).
The primary security data are:
- Logs that contain critical security values are used for real-time monitoring, alerts, and analytics.
- Best monitored proactively, enabling security detections.
Examples: Endpoint Detection and Response (EDR) or antivirus logs, authentication logs, audit trails from cloud platforms, and alerts from external systems.
The secondary security data are:
- High-volume, verbose logs.
- Contains limited security value but can help draw the full picture of a security incident or breach.
- Not frequently used for deep analytics and alerts, and accessed on-demand for ad-hoc querying, investigations, and search.
Examples: NetFlow logs, firewall logs like Fortinet (which is our topic here), Palo Alto, etc., and proxy logs.
Understanding Fortinet Logs
Before we look at the technical implementation of optimizing log ingestion, let’s first look at the Fortinet logs generated by the forward traffic policy.
In Fortinet firewall terminology, forward traffic refers to any traffic **not destined for an IP on the FortiGate itself**. Forward traffic is regulated by firewall policies, which are the cornerstone of FortiGate’s traffic management. These policies define how traffic is processed, where it is sent, and whether it is allowed to pass through the FortiGate.
When a FortiGate firewall receives a connection packet, it evaluates the packet’s source address, destination address, service (port number), incoming interface, outgoing interface, and time of day. Based on these attributes, it searches for a matching policy. If a match is found and the policy action is “Accept,” the traffic is processed accordingly. Otherwise, the traffic is denied or discarded.

Prerequisites
To follow this article, you need to have the following:
1) Azure subscription — If you don’t have an Azure subscription, you can create one here for free.
2) Log Analytics workspace — To create a new workspace, follow the instructions to create a Log Analytics workspace. A Microsoft Sentinel workspace is required to ingest CEF data into Log Analytics. You also must have read and write permissions on this workspace, you need at least contributor rights.
3) Microsoft Sentinel — To enable Microsoft Sentinel at no additional cost on an Azure Monitor Log Analytics workspace for the first 31 days, follow the instructions here. Once Microsoft Sentinel is enabled on your workspace, every GB of data ingested into the workspace can be retained at no charge (free) for 90 days.
4) Common Event Format (CEF) via AMA — You need to create and configure a Linux machine to collect the logs from your Fortinet devices and forward them to the Microsoft Sentinel workspace. This machine will play two roles: collector and forwarder. Please note that this machine can be physical or virtual in your on-premises environment, an Azure VM, or a VM in another cloud. Deploying the CEF collector machine close to the source (devices and appliances) is recommended.
// Related: Effective Approach To Collect Linux Logs to Microsoft Sentinel.
5) Network Data Source based on CEF via AMA — This could be Fortinet, Palo Alto Networks, or any other network or security appliance you have.
6) Configure the FortiGate to send the logs to the Linux Machine, SSH to the FortiGate Instance, or open a CLI Console and run the following command. Notice that the facility is set to `local7`, which needs to be configured in the Data Collection Rule (DCR) on the Sentinel side (more on this in the next section), and the format as CEF has been configured.
config log syslogd setting
    set status enable
    set server <----- The IP Address of the Log Forwarder Collector Machine.
    set mode udp
    set port 514
    set facility local7
    set format cef
end
7) Create custom tables in the Log Analytics workspace (more on this in the next section).
8) Create a Data Collection Rule (DCR) with ingestion-time transformation (more on this in the next section).
Assuming you have all the prerequisites in place, take the following steps:
Identifying High-Traffic Policies
Before optimizing log ingestion, it is crucial to identify the Fortinet policies generating the highest volume of logs. High-traffic policies often contribute significantly to log costs. The following KQL query helps determine the most “noisy” policies by analyzing the count of logs generated per policy:
CommonSecurityLog
| extend policy_id = extract("FTNTFGTpolicyid=(\\d+)", 1, AdditionalExtensions)
| where isnotempty(policy_id)
| extend policy_name = strcat("FTNTFGTpolicyid=", tostring(policy_id))
| summarize count() by DeviceEventCategory, policy_id, policy_name
| sort by count_
This KQL query extracts the `policy_id` from the `AdditionalExtensions` field identifies the associated policies and summarizes the log count by `DeviceEventCategory`, `policy_id`, and `policy_name`. As shown in the figure below, sorting by the count of logs reveals the most significant policy contributors to log volume.

In this example, we see that policy numbers 0, 6, and 71 with traffic forward generate a lot of logs for the past 24 hours.
Solution: Ingestion-Time Transformation
The ingestion-time transformation is designed to:
1. Route all traffic to the default `CommonSecurityLog` table, **except** for forward traffic with specific policy numbers (e.g., 124, 68, 55).
2. Forward traffic logs matching these specific policy numbers are routed to custom tables configured for the Basic Tier, significantly reducing ingestion costs.
Optimize Log Ingestion
First, we must create a Data Collection Rule (DCR) to split our data stream to filter and customize the log ingestion in the Microsoft Sentinel workspace into three different custom tables.
Azure Monitor utilizes Data Collection Rules (DCRs), which are resources that establish the data collection process. These rules outline the specifics of a given data collection scenario, such as what data to gather, how to alter it, and where to transmit it.
Data Collection Rules (DCRs) are Azure resources that define the data collection process in Azure Monitor. It defines the details of a particular data collection scenario, including which data should be collected, how to transform it, and where to send it.
For Microsoft Sentinel, there are three primary use cases for which you can use Data Collection Rules:
- You can create DCR rules associated with an Azure Monitor Agent (AMA). More details will be provided in the next section.
- You can send data to the REST API connected to a Data Collection Endpoint (DCE) linked to a Data Collection Rule (DCR).
- Or, when you want to use transformations for a legacy workload that does not support DCR or data connectors, you can associate a DCR to the workspace and use it for supported tables.
For our scenario, we will use the first use case. We will create a DCR rule associated with the Common Event Format (CEF) via Azure Monitor Agent (AMA) to receive the data from an AMA agent and send it to a Log Analytics workspace.
To get familiar with how Data ingestion flows in Microsoft Sentinel, check the official Microsoft documentation, where you can find the following schema that can help you understand the different ingestion flows:

// Reference: See the difference between Workspace transformation DCR and Standard DCR.
For our scenario with the `CommonSecurityLog`, we will use Standard DCR. In both the Custom Logs and Azure Monitor Agent structures, it is possible to create a standard DCR. The key point is that each connector or log source can have a dedicated DCR, while multiple connectors or sources can also share a common standard DCR.
With data transformation, you can send data to multiple destinations (tables) in a Log Analytics workspace, where you can provide a KQL transformation for each destination. Currently, the tables in the DCR must reside in the same Log Analytics Workspace.
As mentioned in the previous section, we want to send the firewall traffic forward logs to multiple tables; we’ll route all traffic to the default `CommonSecurityLog`Analytics table, except for forward traffic logs with specific policy numbers, that will be routed to custom tables configured for the Basic Tier to reduce ingestion costs significantly.
Create Custom Tables
In this section, we’ll create three custom tables with the Basic tier to store Fortinet’s specific traffic logs policies. In this way, we can use these tables for investigation and compliance reasons as needed.
There are several methods that you can use to create a custom table. You can use the Azure portal (Log Analytics workspace > Tables), as shown in the figure below, or you can use ARM templates, REST API, Bicep, Azure PowerShell, or the Azure CLI.

To make things easier and faster, we will use PowerShell from Azure Cloud Shell to make REST API calls using the Azure Monitor Tables API to create the custom table.
Open the Cloud Shell at (https://shell.azure.com), sign in with your account, and ensure the environment is set to PowerShell and NOT to Bash.
Next, copy the PowerShell function below and save it on your machine as a `.ps1` file; then, you need to update/replace the `$WorkspaceId` and the `$ResourceId` variables under the # Constants section. To obtain this information, open “Log Analytics workspace” in the Azure portal, choose your Workspace, and then go to Properties. You will find both values, as shown in the figure below.

function Create-CustomTable {
    <#
    .SYNOPSIS
        Creates or updates a custom table in Azure Log Analytics.

    .DESCRIPTION
        This function allows you to create a new custom table in Azure Log Analytics or update an existing table
        by duplicating the schema of a specified source table.

    .NOTES
        File Name : Create-CustomTable.ps1
        Author    : Microsoft MVP/MCT - Charbel Nemnom
        Version   : 1.0
        Date      : 13-December-2024
        Updated   : 16-December-2024
        Requires  : Azure Cloud Shell

    .LINK
        To provide feedback or for further assistance please visit:
        https://charbelnemnom.com

    .PARAMETER TableName
        The name of the source table to copy the schema from.

    .PARAMETER NewTableName
        The name of the new custom table to create (suffix _CL recommended).

    .PARAMETER NewTableDescription
        A description for the new custom table.

    .PARAMETER Type
        The table type (analytics, basic, auxiliary). Defaults to 'analytics'.

    .PARAMETER Retention
        Interactive retention period in days (30-730 for analytics).

    .PARAMETER TotalRetention
        Total retention archive period in days (30-4383).

    .EXAMPLE
        Create-CustomTable -TableName "CommonSecurityLog" -NewTableName "NewTable_CL" -Type "basic" -TotalRetention 365
    #>

    param (
        [Parameter(Mandatory)]
        [string]$TableName,

        [Parameter(Mandatory)]
        [string]$NewTableName,

        [Parameter(Mandatory)]
        [string]$NewTableDescription,

        [string]$Type = "analytics",

        [int]$Retention,

        [int]$TotalRetention
    )

    # Constants
    $WorkspaceId = "00000000-0000-0000-0000-000000000000"
    $ResourceId = "/subscriptions/00000000-0000-0000-0000-000000000000/resourceGroups/Resource-Group-Name/providers/Microsoft.OperationalInsights/workspaces/Workspace-Name"
    $ValidTypes = @("analytics", "basic", "auxiliary")

    # Validate Type
    if (-not ($ValidTypes -contains $Type.ToLower())) {
        Write-Warning "Invalid table type provided. Defaulting to 'analytics'."
        $Type = "analytics"
    }

    # Adjust type-specific defaults
    switch ($Type.ToLower()) {
        "auxiliary" {
            $Retention = $null  # Retention is not allowed for Auxiliary Logs
        }
        "basic" {
            $Retention = $null  # Retention is not allowed for Basic Logs
        }
        "analytics" {
            if (-not $Retention -or $Retention -lt 30 -or $Retention -gt 730) {
                Write-Warning "Invalid retention value. Setting to workspace default."
                $Retention = $null
            }
        }
    }

    # TotalRetention validation
    if (-not $TotalRetention -or $TotalRetention -lt 30 -or $TotalRetention -gt 4383) {
        Write-Warning "Invalid total retention value. Setting to table default."
        $TotalRetention = $null
    }

    # Get schema from the source table
    Write-Output "[Querying $TableName schema...]"
    $Query = "$TableName | getschema | project ColumnName, ColumnType"
    $QueryResult = az monitor log-analytics query -w $WorkspaceId --analytics-query $Query -o json | ConvertFrom-Json

    if ($LASTEXITCODE -ne 0) {
        Write-Error "Failed to query the table schema."
        return
    }

    Write-Output "[Table schema successfully retrieved.]"

    # Process columns
    $Columns = $QueryResult | Where-Object {
        $_.ColumnName -notin @("TenantId", "Type", "Id", "MG") -and
        ($Type -ne "auxiliary" -or $_.ColumnType -ne "dynamic")
    } | ForEach-Object {
        if ($Type -eq "auxiliary" -and $_.ColumnType -eq "bool") {
            $_.ColumnType = "boolean"
        }
        @{
            name = $_.ColumnName
            type = $_.ColumnType
        }
    }

    # Construct table parameters
    $TableParams = @{
        properties = @{
            schema = @{
                name        = $NewTableName
                description = $NewTableDescription
                columns     = $Columns
            }
            plan   = $Type
        }
    }

    if ($Retention -and $Type -eq "analytics") { $TableParams.properties.retentionInDays = $Retention }
    if ($TotalRetention) { $TableParams.properties.totalRetentionInDays = $TotalRetention }

    # Convert table parameters to JSON
    $TableParamsJson = $TableParams | ConvertTo-Json -Depth 10

    # Create or update the table
    Write-Output "[Creating/updating table $NewTableName...]"
    $Response = Invoke-AzRestMethod -Path "$ResourceId/tables/${NewTableName}?api-version=2023-01-01-preview" -Method PUT -Payload $TableParamsJson

    if ($Response.StatusCode -eq 200 -or $Response.StatusCode -eq 202) {
        Write-Output "[Success] Table '$NewTableName' created/updated successfully."
    }
    else {
        Write-Error "Failed to create/update the table. Status code: $($Response.StatusCode)"
        if ($Response.Content) {
            $ErrorDetails = $Response.Content | ConvertFrom-Json
            Write-Error "Error Code: $($ErrorDetails.error.code)"
            Write-Error "Error Message: $($ErrorDetails.error.message)"
        }
    }
}
Once the variables ($WorkspaceId and $ResourceId) are updated, save the function and upload it to the Azure Cloud Shell using the Manage files > Upload option, as shown in the figure below.

Once uploaded, you need to dot source the function as follows: `. .\Create-CustomTable.ps1` and then run the following command to create the custom table(s). You can update the source table name, the new table name, the table type (Analytics, Basic, or Auxiliary), retention, total retention, and the description for the new table. In this example, we didn’t set the retention value because, for the Basic and Auxiliary tiers, the retention is always 30 days.
Create-CustomTable -TableName "CommonSecurityLog" -NewTableName "FortinetPolicyId55BasicLog_CL" -Type "basic" -TotalRetention 90 -NewTableDescription "This custom table is to store the firewall forward traffic for policy ID 55!"This function will capture the schema of the existing Sentinel `CommonSecurityLog` table and create a new custom table with the same schema! You will get an output similar to the one below.

Next, switch to the Azure portal, then go to your “Log Analytics workspace > Tables” and verify that the new custom table has been created. Please note that you must repeat the same steps to create one or more custom tables as needed.
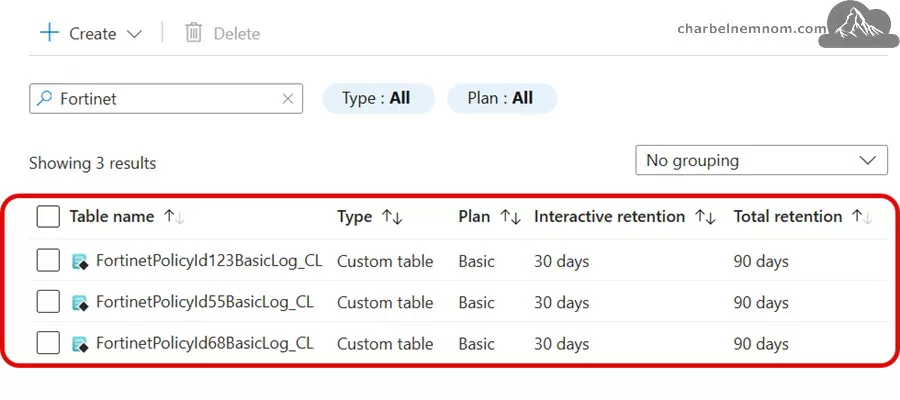
Once the custom tables are created with the Basic tier, we can move to create ingestion-time transformation using the data collection rule (DCR).

Create DCR for CEF via AMA
To create AMA-related DCRs, go to the Microsoft Sentinel Data Connectors blade, then search for Common Event Format (CEF) via AMA.
Open the connector, and then click on “+Create data collection rule”, so you will be able to create DCR for CEF forwarding.

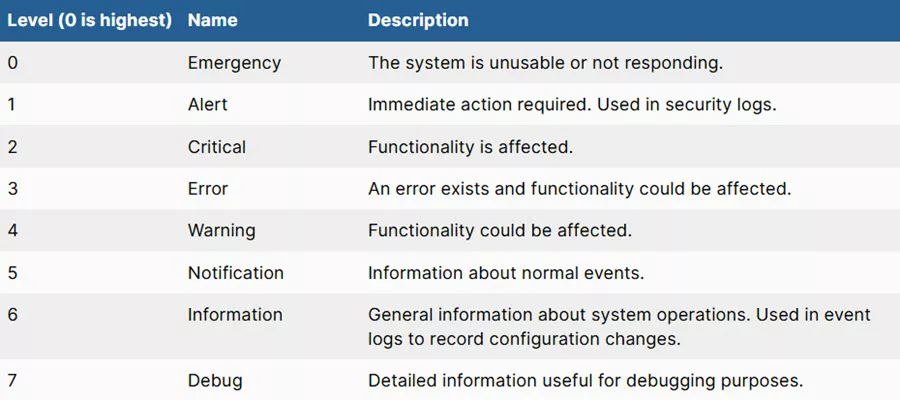
Give the DCR rule a name, select your Linux CEF collector machine, and then select the correct facilities on the `Collect` tab. As mentioned in the prerequisites section, we configured the FortiGate to send the logs to the Linux Machine and set the facility to `local7`, so we need to choose `LOG_LOCAL7` and set the minimum log level to `LOG_NOTICE`, as shown in the figure below. The data connector wizard will help you to create the DCR for your use case.

As a side note, when a logging severity level is defined, the FortiManager or FortiAnalyzer unit logs all messages at and above the selected severity level. For example, if you select Notice (Notification) as described in this scenario, the FortiManager or FortiAnalyzer unit logs Notification, Warning, Error, Critical, Alert, and Emergency level messages.
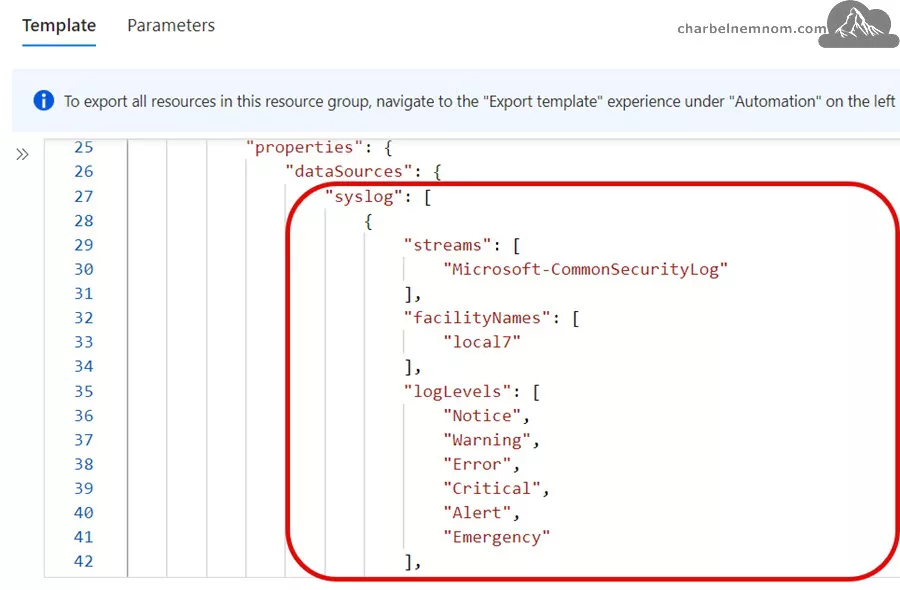
Now that we created the DCR for CEF when we check the DCR ARM template, we see that the data connector now created a data flow stream to send events to the default `CommonSecurityLog` native table.

Under the data sources, we see Syslog with the Syslog facilities `local7` and the log levels (Notice, Warning, Error, Critical, Alert, and Emergency) that we chose in the “Collect” tab.
The next step is to create an ingestion-time transformation using this DCR.
Create Ingestion-Time Transformation
When we created the DCR for the AMA connector, as described in the previous step, we could not create a Transformation KQL in the portal. This does not mean transformations are not supported for these DCRs. We can add a “transformKql” and an “outputStream” to the ARM template as described in the following steps.
First, you need to browse to the newly created DCR (direct URL for Data collection rules), then go to the “Export template” under “Automation“. To create KQL transformations to a supported standard table, click on “Deploy” as shown in the figure below:
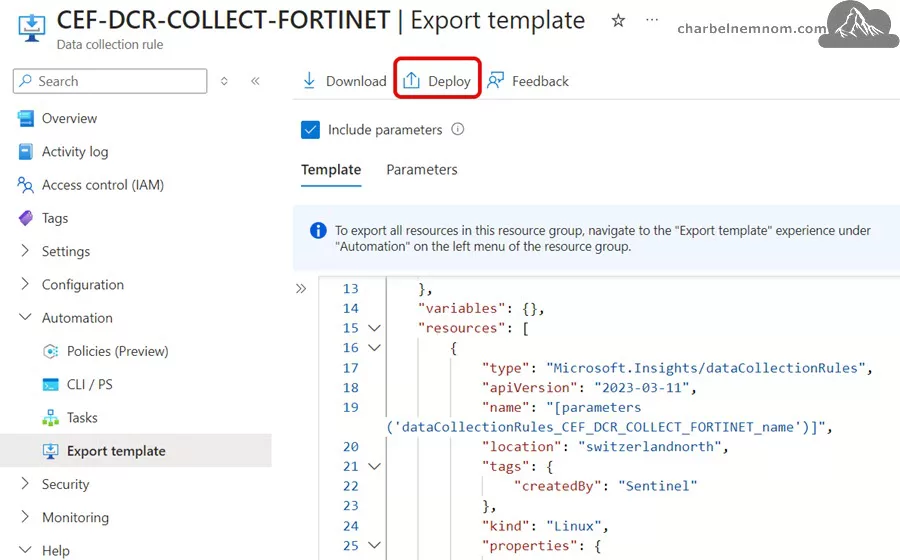
Next, click on “Edit template” and then scroll to the “dataFlows” section. We need to add “transformKql” and the “outputStream” to split and route the logs to the corresponding table.
For this example, we want to send the firewall forward traffic logs to multiple tables; we’ll route all traffic to the default `CommonSecurityLog`Analytics native table, except for forward traffic logs with specific policy numbers (124, 68, and 55), will be routed to three custom tables we created previously with the Basic plan to reduce ingestion costs.
The following JSON snippet illustrates the `dataFlows` logic section implemented in the data collection rule (DCR). Remember that standard tables must include “Microsoft-” in front of them and “Custom-” for custom tables.
"dataFlows": [
{
"streams": [
"Microsoft-CommonSecurityLog"
],
"destinations": [
"DataCollectionEvent"
],
"transformKql": "source | extend policy_id = tostring(extract(\"FTNTFGTpolicyid=(\\\\d+)\", 1, AdditionalExtensions)) | where DeviceEventCategory != 'traffic:forward' or (DeviceEventCategory == 'traffic:forward' and (isnotempty(policy_id) == false or policy_id !in (\"124\", \"68\", \"55\")))",
"outputStream": "Microsoft-CommonSecurityLog"
},
{
"streams": [
"Microsoft-CommonSecurityLog"
],
"destinations": [
"DataCollectionEvent"
],
"transformKql": "source | where DeviceEventCategory == 'traffic:forward' | extend policy_id = tostring(extract(\"FTNTFGTpolicyid=(\\\\d+)\", 1, AdditionalExtensions)) | where isnotempty(policy_id) and policy_id == \"124\"",
"outputStream": "Custom-FortinetPolicyId124BasicLog_CL"
},
{
"streams": [
"Microsoft-CommonSecurityLog"
],
"destinations": [
"DataCollectionEvent"
],
"transformKql": "source | where DeviceEventCategory == 'traffic:forward' | extend policy_id = tostring(extract(\"FTNTFGTpolicyid=(\\\\d+)\", 1, AdditionalExtensions)) | where isnotempty(policy_id) and policy_id == \"68\"",
"outputStream": "Custom-FortinetPolicyId68BasicLog_CL"
},
{
"streams": [
"Microsoft-CommonSecurityLog"
],
"destinations": [
"DataCollectionEvent"
],
"transformKql": "source | where DeviceEventCategory == 'traffic:forward' | extend policy_id = tostring(extract(\"FTNTFGTpolicyid=(\\\\d+)\", 1, AdditionalExtensions)) | where isnotempty(policy_id) and policy_id == \"55\"",
"outputStream": "Custom-FortinetPolicyId55BasicLog_CL"
}
]
Please note that the custom table must also be created before you can send data to it. If this is not the case, the deployment of the ARM template will fail. Once you have saved the template, you must create (deploy) the template to the same existing DCR for CEF-AMA.
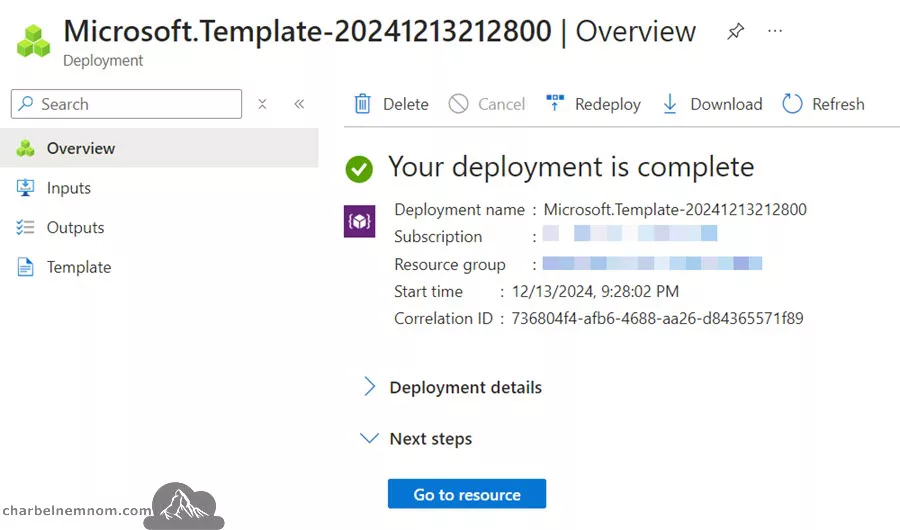
Please note that the transformations do not incur additional costs, but if you filter out more than 50% of the data, it’ll cause a “data processing charge” (in non-Sentinel workspaces), which does not apply in our scenario. In that case, filtering that data out in rsyslog or at the source (Fortinet side) is recommended.
Explanation of Data Flows
Let’s look at the Ingestion-Time Transformation data flows that we used:
Default Routing:
– All logs are routed to the `Microsoft-CommonSecurityLog` table unless they meet specific conditions.
– Logs are excluded from the default `Microsoft-CommonSecurityLog` table if they belong to forward traffic with policy numbers 124, 68, or 55.
Custom Routing:
– Forward traffic with `policy_id` 124 is routed to the `Custom-FortinetPolicyId124BasicLog_CL` table.
– Forward traffic with `policy_id` 68 is routed to the `Custom-FortinetPolicyId68BasicLog_CL` table.
– Forward traffic with `policy_id` 55 is routed to the `Custom-FortinetPolicyId55BasicLog_CL` table.
This setup ensures that logs most relevant to specific policies are ingested at a lower cost tier.
Fortinet Policy ID Extraction
To identify the correct policy ID from forward traffic logs in Fortinet, we extract the `policy_id` number from the `AdditionalExtensions` field using the following logic:
policy_id = tostring(extract("FTNTFGTpolicyid=(\\d+)", 1, AdditionalExtensions))The `AdditionalExtensions` field in the `CommonSecurityLog` table for Fortinet is very long and looks something similar to the example below:

This extraction ensures accurate identification of policy numbers for routing decisions.
The last step is to test and verify that the traffic forward logs with their corresponding policy numbers are redirected correctly to the desired custom table.
Verify Ingestion-Time Transformation
Allow about 15 to 30 minutes for the transformation to take effect, and you can then test it by running a query against the default and custom tables. Only data sent to the table after applying the transformation will be affected.
Default Routing CommonSecurityLog
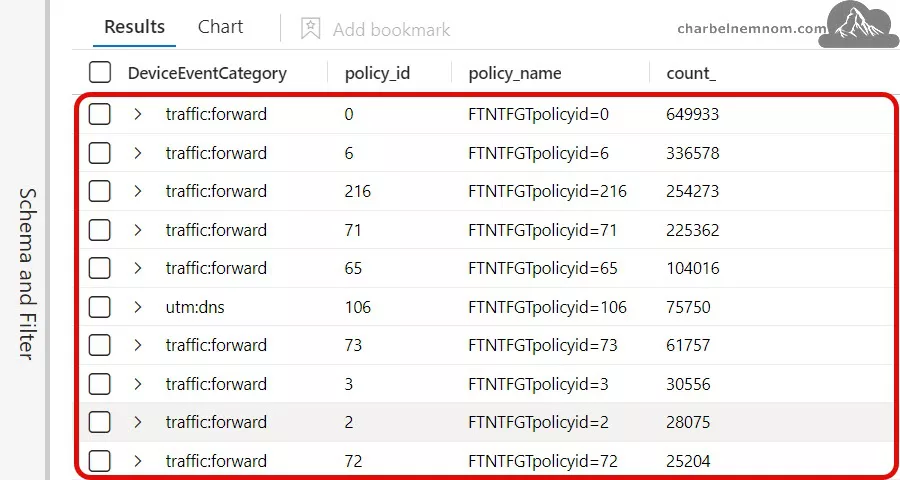
For our scenario, we’ll run the following KQL query to verify that all traffic forward is landing in the default `CommonSecurityLog` table except for traffic forward that matches policy numbers 124, 68, and 55:
CommonSecurityLog
| extend policy_id = extract("FTNTFGTpolicyid=(\\d+)", 1, AdditionalExtensions)
| where isnotempty(policy_id)
| extend policy_name = strcat("FTNTFGTpolicyid=", tostring(policy_id))
| summarize count() by DeviceEventCategory, policy_id, policy_name
| sort by count_
As we can see in the results below, we don’t see any entry that matches `DeviceEventCategory` traffic forward with policy numbers equal to 124, 68, or 55.
Custom Routing Policy ID 124
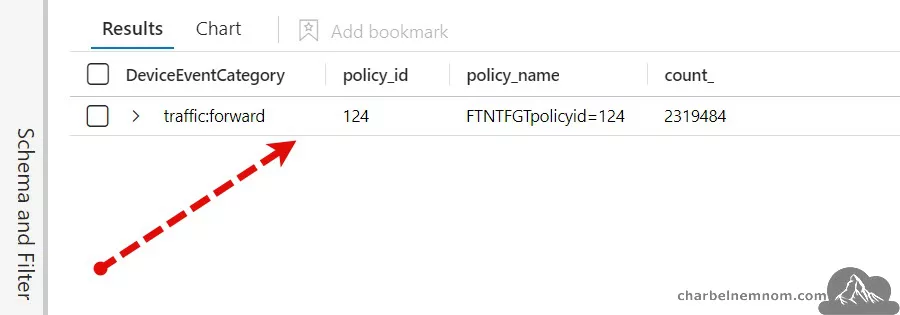
Next, we’ll run the following KQL query to verify that only traffic forward that matches policy number 124 is landing in the custom `FortinetPolicyId124BasicLog_CL` table:
FortinetPolicyId124BasicLog_CL
| extend policy_id = extract("FTNTFGTpolicyid=(\\d+)", 1, AdditionalExtensions)
| where isnotempty(policy_id)
| extend policy_name = strcat("FTNTFGTpolicyid=", tostring(policy_id))
| summarize count() by DeviceEventCategory, policy_id, policy_name
| sort by count_
As we can see in the results below, we only see an entry that matches `DeviceEventCategory` traffic forward with policy numbers equal to 124.
Custom Routing Policy ID 68
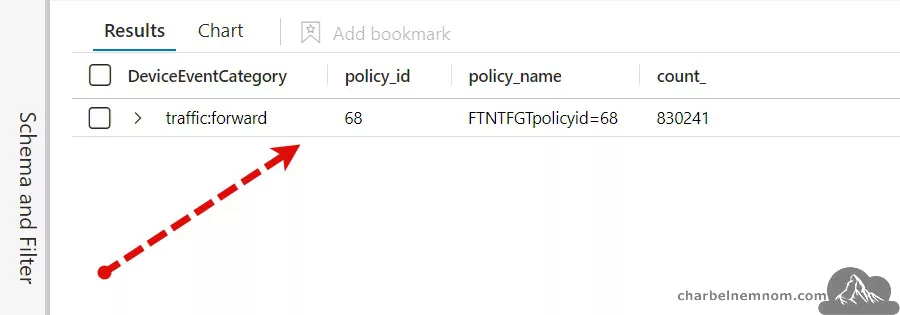
Next, we’ll run the following KQL query to verify that only traffic forward that matches policy number 68 is landing in the custom `FortinetPolicyId68BasicLog_CL` table:
FortinetPolicyId68BasicLog_CL
| extend policy_id = extract("FTNTFGTpolicyid=(\\d+)", 1, AdditionalExtensions)
| where isnotempty(policy_id)
| extend policy_name = strcat("FTNTFGTpolicyid=", tostring(policy_id))
| summarize count() by DeviceEventCategory, policy_id, policy_name
| sort by count_
As we can see in the results below, we only see an entry that matches `DeviceEventCategory` traffic forward with policy numbers equal to 68.
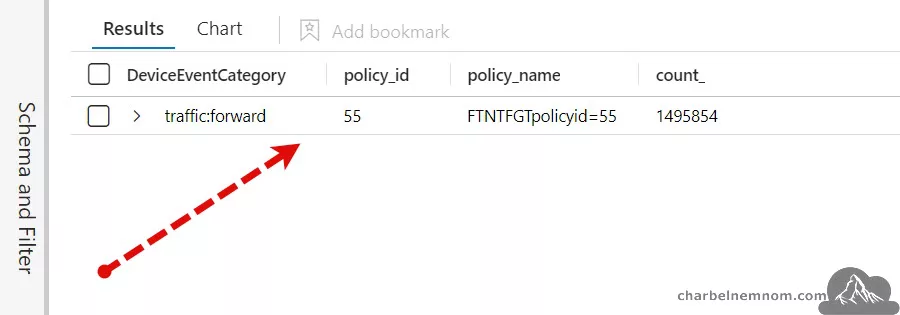
Custom Routing Policy ID 55
Last, we’ll run the following KQL query to verify that only traffic forward that matches policy number 55 is landing in the custom `FortinetPolicyId55BasicLog_CL` table:
FortinetPolicyId55BasicLog_CL
| extend policy_id = extract("FTNTFGTpolicyid=(\\d+)", 1, AdditionalExtensions)
| where isnotempty(policy_id)
| extend policy_name = strcat("FTNTFGTpolicyid=", tostring(policy_id))
| summarize count() by DeviceEventCategory, policy_id, policy_name
| sort by count_
As we can see in the results below, we only see an entry that matches `DeviceEventCategory` traffic forward with policy numbers equal to 55.
Future Outlook with Auxiliary Logs
Microsoft introduced a new Auxiliary Logs, a third tier, back in July 2024, which is much cheaper for Microsoft Sentinel and Log Analytics. Auxiliary Logs also include 30 days of interactive retentions. Integrating Auxiliary Logs and Summary Rules represents a significant step forward in optimizing log management and security monitoring for organizations of all sizes.
At the time of this writing, data transformations for the Auxiliary log are not supported yet, so we cannot route the logs to different custom tables as illustrated above. Ingestion-time transformation for the Auxiliary logs is planned for the beginning of 2025, allowing us to send Common Event Format (CEF) natively via Azure Monitor Agent (AMA). But for now, we must use a third-party tool like Logstash or Cribl to send firewall logs directly to the `CommonSecurityLog` native table.
Basic Logs also include 30 days of interactive retentions and full KQL support on a single table and lookup to the Analytics table. So, until the ingestion-time transformation for the Auxiliary logs becomes supported, we could leverage the Basic Logs tier to reduce and minimize the log ingestion costs.
In Conclusion
Cost optimization is a key factor when managing security data in Microsoft Sentinel, particularly for high-volume sources like Fortinet firewall logs. Organizations can significantly reduce operational costs while maintaining robust security capabilities by leveraging ingestion-time transformation and routing logs to the appropriate tiers.
This approach ensures that critical logs remain in the Analytics tier for real-time monitoring and alerting, while less critical logs are stored cost-effectively in the Basic tier. Implementing such strategies allows security teams to allocate resources more effectively, improve incident response, and stay within budget constraints.
We hope this guide has provided valuable insights into optimizing your log ingestion strategy in Microsoft Sentinel. Take the first step today to reduce your Fortinet log ingestion costs without compromising security.
__
Thank you for reading our blog.
Please let us know in the comments section below if you have any questions or feedback.
-Charbel Nemnom-

Hi this is a really useful guide, thanks for posting it.
I do wonder though, at the end we’re left with the ‘noisiest’ policy logs routing to custom, basic tables and the rest going to CommonSecurityLog.
But anyone using analytics rules from Sentinel’s built-in templates will only have their CommonSecurityLog data scanned, and those custom tables we’ve created are now effectively being ignored by the brain of Sentinel, aren’t they?
Hello Jack, thanks for your comment and feedback!
Yes, the “noisiest” policy logs are routed to custom Basic tables, while the remaining logs go to the default
CommonSecurityLogtable. Keep in mind that the Basic and Auxiliary tables are intended for investigation, compliance, and forensics—not for direct detection.To use data from Basic/Auxiliary tables for detection (the brain of Sentinel), you must first employ Summary Rules (in preview) to extract and summarize the necessary logs into a destination Analytics custom table. Then, you can create Analytics Rules targeting this new custom table under the Analytics plan.
Currently, Auxiliary tables do not support transformation, though this feature is coming soon. You can apply the same logic described in the article for Auxiliary tables instead of Basic tables.
For more details, please check out the article: Optimize Fortinet Traffic Logs into Microsoft Sentinel.
Hope this helps!