Microsoft Sentinel has matured into one of the most capable cloud-native SIEM and SOAR platforms on the market. With the Content hub, the unified SKU, and the Sentinel data lake, you can deploy a working SOC faster than before. But that speed has a downside: detection content becomes outdated over time. Analytics rules get deployed and never updated, rules run against tables that receive no data, and high-value log sources stay disconnected while low-value ones continue to generate ingestion costs every day.
In our day-to-day work with customers, we see the same pattern again and again. The workspace appears healthy, but nobody can answer a simple question: how well calibrated is our detection posture today?
In this hands-on series, we used Seculyze in our own Microsoft Sentinel environment. Seculyze is a SaaS platform that connects to your Microsoft Sentinel workspace and helps you calibrate detection content, tune alert noise, and control ingestion cost. We’ll show you what it found in our environment, how its scoring works, and which recommendations you should review before acting on them.
Here is the plan for the series:
• Part 1 – Calibrate Your Detection Posture (this article): onboarding, the Calibrate score, analytics rules, log sources, and configuration checks.
• Part 2 – Cost Control: data collection rule (DCR) transformations, ingestion budgets, and ingestion anomaly detection.
• Part 3 – Tune: machine learning–based false positive classification, threat intelligence enrichment, and a safe rollout path to auto-closing incidents.
• Part 4 – Automate: AI-generated incident reports and the monthly executive report.
Table of Contents
Common Challenges with Microsoft Sentinel Detection Content
Before we look at the product, let’s be clear about the problem it is trying to solve. In our experience, detection posture degrades in four predictable ways:
- Outdated rule templates. Content hub solutions ship analytics rule templates with version numbers. When Microsoft publishes a new version, the rules you already created from the old template do not update themselves. You must find the update and apply it, rule by rule.
- Rules without data. It is easy to enable a rule from a solution even though the table it queries receives no data. The rule runs every few minutes, finds nothing, and gives you a false sense of coverage. On a dashboard, a rule that never fires looks exactly like a rule with nothing to catch.
- Noisy, low-value rules. Broad rules that fire often and are almost always benign consume analyst time and make the alerts that matter harder to spot.
- Log sources out of balance. High-value sources, often free ones such as Microsoft 365 audit logs, remain disconnected, while expensive sources with few detections attached keep increasing your ingestion costs.
None of these is hard to fix on its own. The challenge is visibility. In a workspace with hundreds of rules and dozens of tables, nobody reviews them all on a regular basis. We described a manual approach to this review in our Ultimate Health Check for Microsoft Sentinel guide. This is the problem that Seculyze’s Calibrate module addresses.
Introducing Seculyze
Seculyze is a SaaS platform built specifically for Microsoft Sentinel. It connects to your workspace through an Entra ID app registration, reads your analytics rules, tables, workspace settings, and incidents, and turns them into prioritized recommendations. The changes you make in Seculyze are written back to Sentinel, so both sides stay in sync.
The platform is organized into five areas:
| Area | What it does |
|---|---|
| Operate | Dashboard, incident view, and notifications |
| Tune | Classifies incidents as true or false positives and can auto-close confirmed false positives |
| Calibrate | Scores analytics rules, log sources, and workspace configuration against best practices |
| Cost | Data collection analysis, ingestion budgets, and ingestion anomaly detection |
| Automate | AI-generated incident reports and a monthly executive report |
In this first part, we focus on Calibrate, because it is where most environments get the fastest return on investment, and because the other modules depend on it. You can’t reduce false positives or optimize cost with confidence if you don’t know which detections are actually working.
Prerequisites and Access Model
To follow along, you need:
• A Microsoft Sentinel workspace.
• Permissions to create an app registration in Microsoft Entra ID and to assign Azure roles on the Sentinel resource group.
• A Seculyze tenant, which the Seculyze team provisions for you at a dedicated URL, for example, https://yourcompany.seculyze.com. You can request one at seculyze.com.
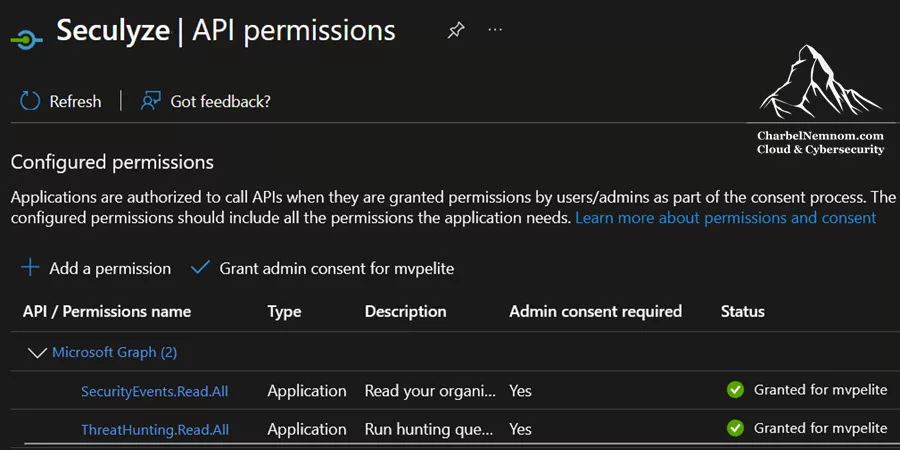
In our environment, we created a single-tenant app registration with the following permissions:
| Permission | Type | Scope |
|---|---|---|
| Log Analytics Reader | Azure RBAC | Log Analytics workspace |
| Microsoft Sentinel Contributor | Azure RBAC | Sentinel resource group |
| SecurityEvents.Read.All | Microsoft Graph (application) | Tenant |
| ThreatHunting.Read.All | Microsoft Graph (application) | Tenant |
We deliberately left out the Monitoring Contributor role for now. Seculyze needs it to change data collection rules (DCRs), such as updating DCR transformations or stopping ingestion from a log source. We’ll cover both in Part 2. The features that need it show a “missing permissions” message but still display their data in read-only mode, so you can start with minimal permissions and grant more as you adopt each module.
Here is how each permission maps to what you can do in Seculyze:
| Permission | What it enables | Without it |
|---|---|---|
| Log Analytics Reader and Microsoft Sentinel Reader | Every read view, including the dashboard, the Calibrate scores, and the recommendations | Seculyze can’t read the Sentinel content or the logs in the workspace tables |
| Microsoft Sentinel Contributor | Applying changes: updating, enabling, and disabling analytics rules, and auto-closing incidents | All views work, but you can’t apply recommendations |
| Monitoring Contributor | Changing data collection rules (DCRs): updating DCR transformations and stopping ingestion from a log source | Those features still show their data in read-only mode |
| SecurityEvents.Read.All and ThreatHunting.Read.All (Microsoft Graph) | The Secure Score and device changes slides in the monthly report, which use Microsoft Defender advanced hunting tables | The incident report works, but the monthly report is incomplete without those two slides |
Read-only mode. You can ask the Seculyze team to set up your tenant in read-only mode. Everything shows in view mode, but you can’t apply or update anything. That’s a good way to start an evaluation, and you can grant Microsoft Sentinel Contributor later, when you’re ready to act on the recommendations.
Our least-privilege recommendation: start with read access only, scope the roles to a dedicated resource group for Sentinel, grant Microsoft Sentinel Contributor when you’re ready to apply changes, use short-lived credentials, and review ThreatHunting.Read.All, which grants read access to all Defender XDR advanced hunting data.
Data Security and Compliance
Seculyze reads analytics rules, table statistics, workspace settings, and incidents from your workspace through the app registration. That data is stored in a PostgreSQL relational database in Seculyze’s own Azure tenant. These are the points that matter most when you assess a SaaS tool that connects to your SIEM:
- Hosting and GDPR: Seculyze runs on Microsoft Azure. By default, customer data is stored in the West Europe region, and the database can be deployed in another region on request, such as North Europe or Denmark East. Authentication to its APIs uses Auth0, hosted in Europe.
- Tenant isolation: each customer’s data is kept in isolated Kubernetes and Azure environments, with separate application and database environments.
- Encryption: data is encrypted in transit with TLS and at rest with AES-256. If you need more control, you can use customer-managed keys, stored in a key vault, with your own key rotation policy.
- Access control: the Seculyze application has three role levels, and Seculyze employees sign in with multifactor authentication through Microsoft Entra ID, following the principle of least privilege.
- Security monitoring: container images are scanned for vulnerabilities, Microsoft Defender protects the Azure resources, and Microsoft Sentinel monitors the platform.
If you work in a regulated environment, ask the Seculyze team how long synced data is kept and how it’s deleted when you offboard, as part of your vendor assessment.
Sync frequency. Most data syncs every hour. The Log Sources view and SentinelHealth update every 24 hours, although log source data is also checked every hour for ingestion anomalies. Microsoft Graph permissions are re-checked every few hours. There’s no manual refresh today, so plan for a delay after you change permissions or connectors.
A First Look at the Seculyze Dashboard
Once Seculyze completed its first sync, the dashboard became our starting point. It brings together four tiles: the Calibrate score, key threats from the last 24 hours, the tuning impact over the last 30 days, and the Microsoft log costs over the same period.
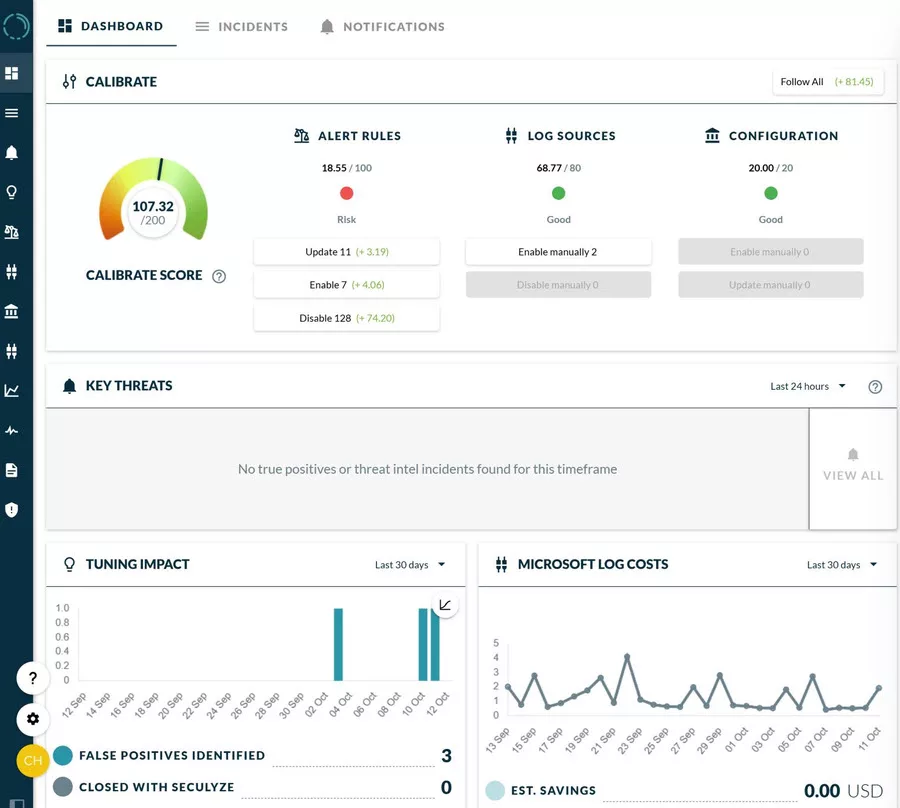
The tile we care about most is the Calibrate tile at the top. Every recommendation comes with the number of points it adds to the score, so you can quickly see which actions improve the score the most. In our environment, the Follow All button shows that applying every recommendation would add 81.45 points.
The tuning and cost tiles are mostly empty in a quiet environment, and that’s expected. An environment with three incidents in 30 days gives the machine learning model nothing to work with. We’ll come back to those tiles in Part 2 and Part 3, once we’ve generated realistic incident volume.
How the Calibrate Score Works
The Calibrate score summarizes your detection posture on a scale of 0 to 200. Our environment scored 107.32 out of 200 on the day we captured these screenshots.
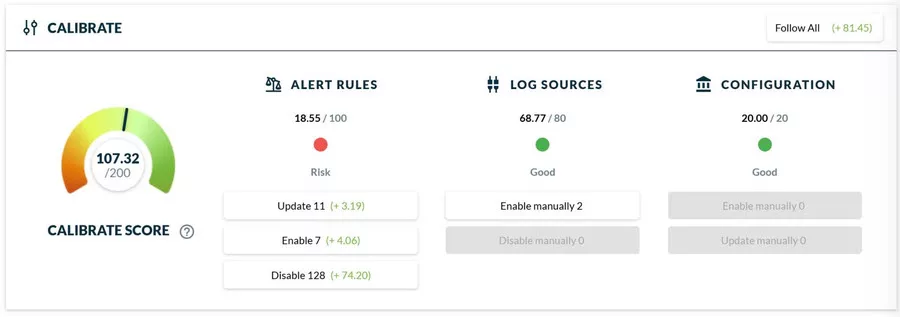
According to the Seculyze documentation, the score is split into three weighted areas:
| Area | Weight | Maximum points | Our environment |
|---|---|---|---|
| Alert Rules | 50% | 100 | 18.55 (Risk) |
| Log Sources | 40% | 80 | 68.77 (Good) |
| Configuration | 10% | 20 | 20.00 (Good) |
The scoring logic is simple. For alert rules and log sources, each item earns points when its state matches its value, and loses points when it doesn’t:
• +2 points for an enabled high-value item or a disabled low-value item.
• –2 points for a disabled high-value item or an enabled low-value item.
• +1 point for an enabled medium-value rule that is linked to a high-value log source.
• –1 point for an alert rule that runs an outdated template version.
• +1 point for a log source with more than two alert rules attached, and –4 points for a log source with none.
Configuration checks are additive only: each recommended setting that is in place earns 2 points, with no deductions.
What we like about this model is that it rewards disabling noise, not just enabling content. Many posture tools push you to turn on more and more detections. Seculyze takes the opposite view: a low-value rule that fires constantly costs more than it adds, and disabling it improves your posture.
The score also reacts quickly to real changes. When we started, our environment scored 80.87, with Log Sources at 47.72 out of 80. The day after we enabled the Microsoft 365 data connector, Log Sources rose to 63.16 and the overall score to 100.17. A few days later, after we enabled SentinelHealth, as described below, Configuration reached 20 out of 20, Log Sources 68.77, and the overall score 107.32. When you fix a gap, the score shows the improvement after the next sync.
Calibrating Analytics Rules
The Alert Rules view is the most useful part of Seculyze. It lists every analytics rule in the workspace (217 in our environment) with its author, template version, MITRE ATT&CK tactics, the log sources it depends on, a value rating, its state, and the recommended action.
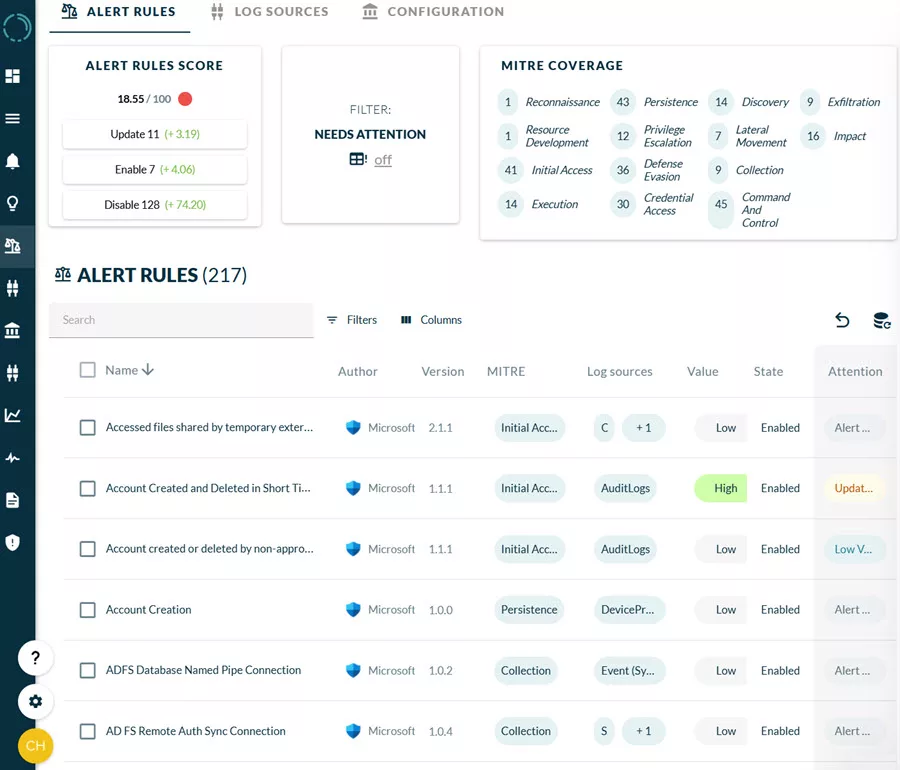
In our environment, Seculyze grouped its recommendations into three actions:
| Action | Rules | Score impact |
|---|---|---|
| Update to the latest template version | 11 | +3.19 |
| Enable high-value rules | 7 | +4.06 |
| Disable low-value rules | 128 | +74.20 |
The Update action alone is useful. Keeping Content hub rules on the latest template version is a task most teams agree is important but rarely complete, because Sentinel requires you to find the update badge rule by rule. Here, the 11 outdated rules are listed in one place. If you prefer to script these changes yourself, we showed how to update Microsoft Sentinel analytics rules in bulk and enable analytics rules at scale with PowerShell.
Review Before You Disable Alert Rules
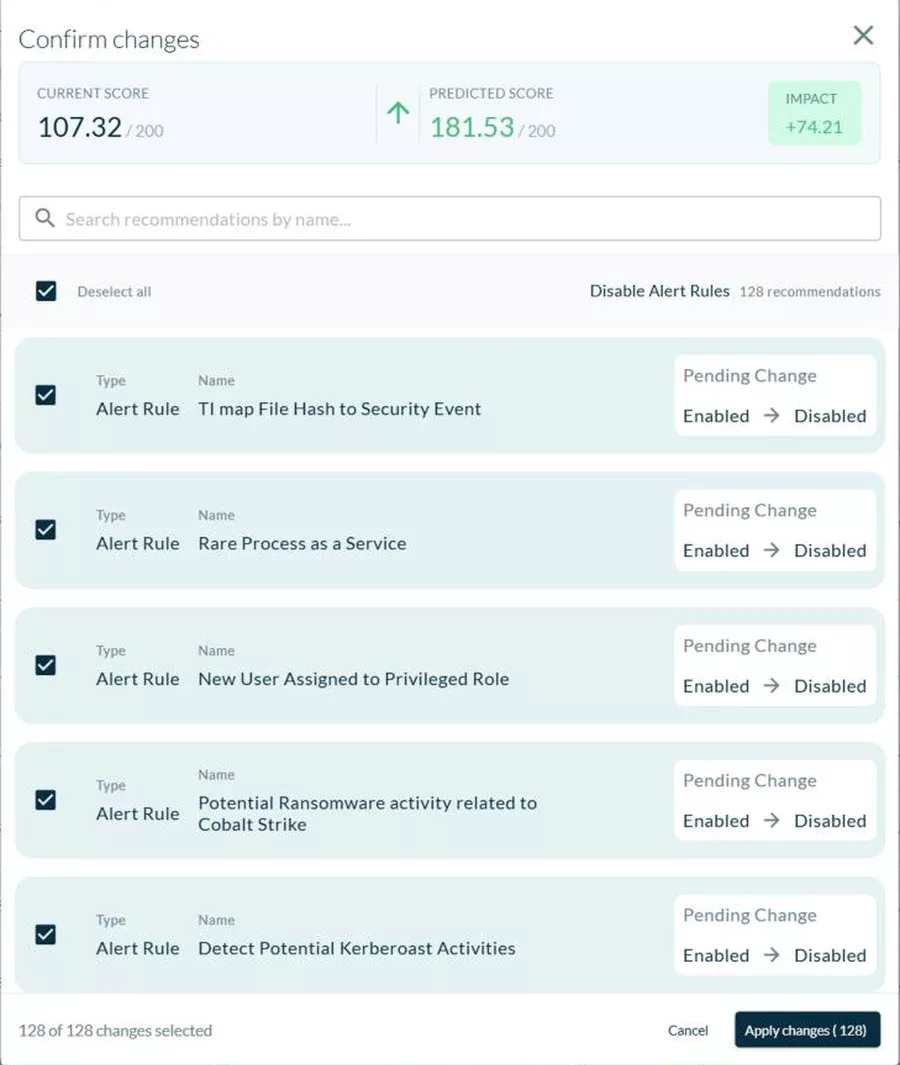
When we clicked Disable in the Alert Rules scorecard, Seculyze didn’t change anything right away. It opened a Confirm changes dialog that shows the current score (107.32), the predicted score (181.53), and the impact (+74.21), followed by every rule it plans to disable, each with its pending change (Enabled → Disabled) and its own checkbox, as shown in the figure below. Nothing is written to Sentinel until you click Apply changes. In our environment, the list contained 128 rules at the time of writing; the number changes as you connect data sources and update rules.
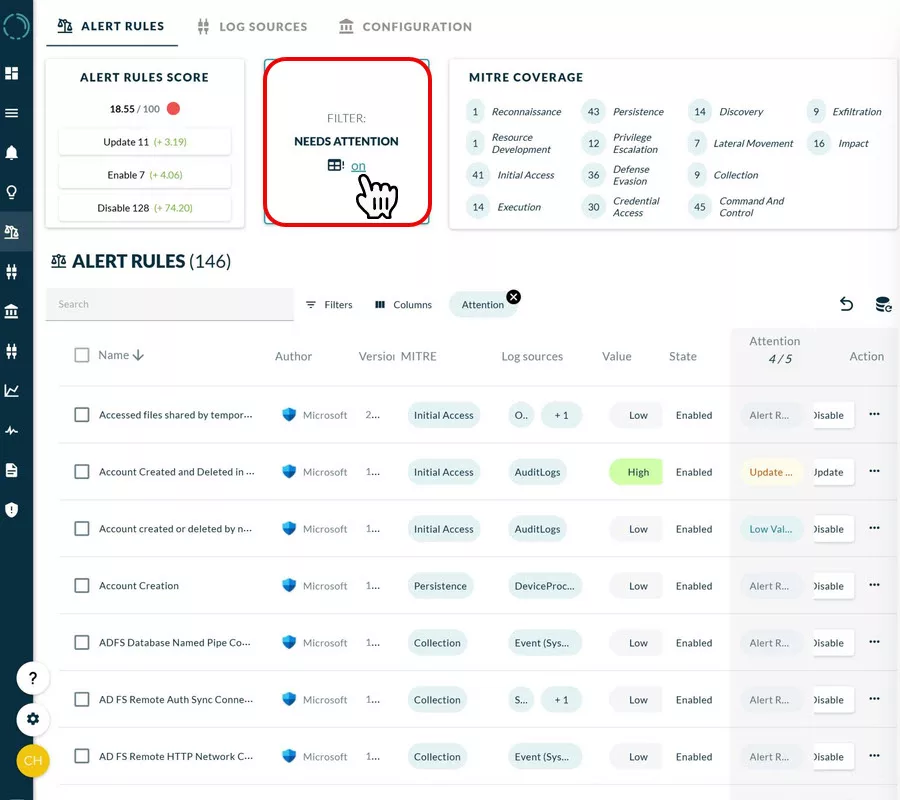
To understand why, you can switch the Needs Attention filter at the top of the Alert Rules view to on. The filter hides every rule that needs no action. In our environment, the list dropped from 217 to 146 rules, which matches the recommendations exactly: 11 updates, 7 enables, and 128 disables, as shown in the figure below. The Attention column then gives the reason for each rule:
• Alert Rule is Missing Logsource(s): the rule queries a table our environment doesn’t ingest, such as Sysmon events, SecurityEvent, or Defender for Endpoint device tables. This was the reason for the large majority of the disable recommendations.
• Low Value Alert Rule is Enabled: the rule is enabled but rated low value.
• High Value Alert Rule is Disabled: a valuable rule that is switched off.
• Update Available: a newer template version exists in the Content hub.
In our environment, disabling them is the right call. In production, we recommend one extra step before you click Disable: check whether you plan to onboard the missing data source. If you do, connect the source first and let Seculyze re-evaluate the rule, rather than disabling content you will need in a few weeks. Read the list carefully: ours included rules such as New User Assigned to Privileged Role and Potential Ransomware activity related to Cobalt Strike, which are flagged only because their data source isn’t connected. You can deselect any rule before you apply the changes.
Disabling doesn’t delete anything. Disable only switches the rule off in Sentinel, so the rule and its query stay in your workspace, and you can turn it back on at any time.
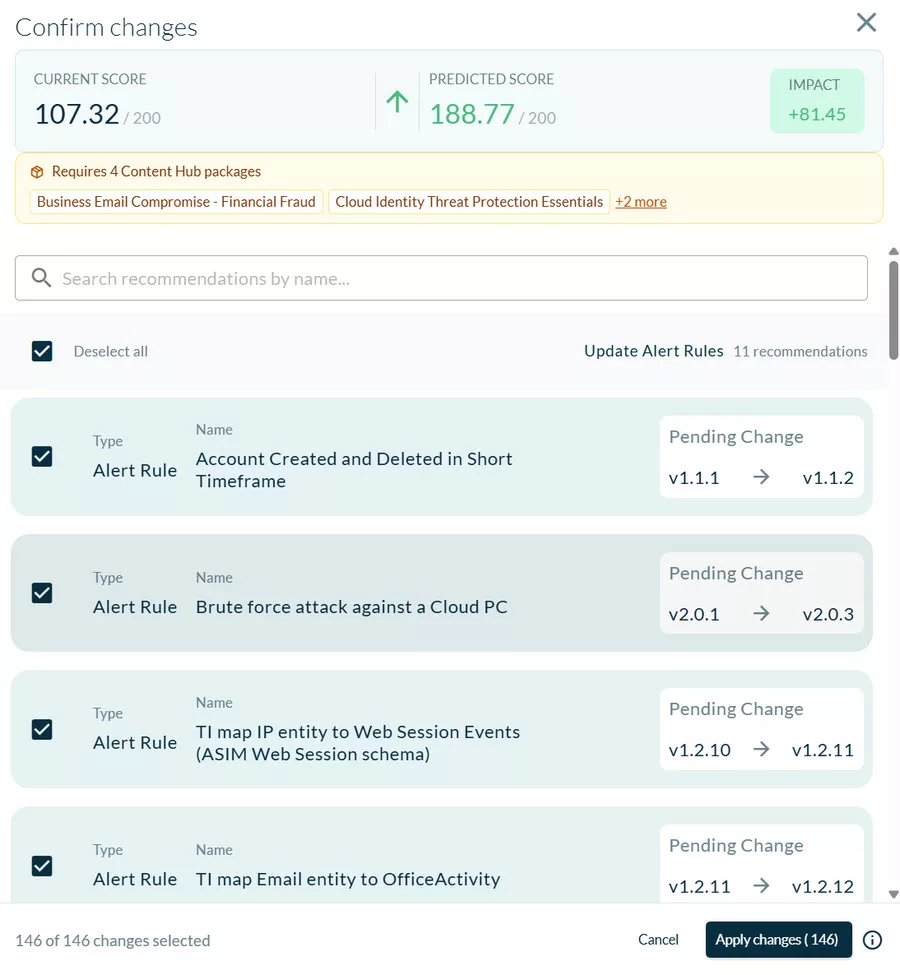
The Follow All button works the same way. It opens the same Confirm changes dialog with all 146 changes grouped by action (11 updates, 7 enables, and 128 disables), the predicted score of 188.77, and the impact of +81.45, as shown in the figure below. For each update, the dialog shows the version change, for example, from v1.1.1 to v1.1.2. It also warns that the changes require four Content hub packages, such as Business Email Compromise – Financial Fraud and Cloud Identity Threat Protection Essentials. Check that list before you click Apply changes, because it tells you which solutions the recommended rules depend on.
How Seculyze Rates Each Rule
Each rule’s value comes from a cost-versus-gain matrix. Cost reflects the analyst time a rule consumes: many alerts and many false positives mean high cost. Gain reflects the rule’s certainty: a narrow scope with high confidence in the alert’s validity means high gain. Low, medium, and high values all come from this same calculation.
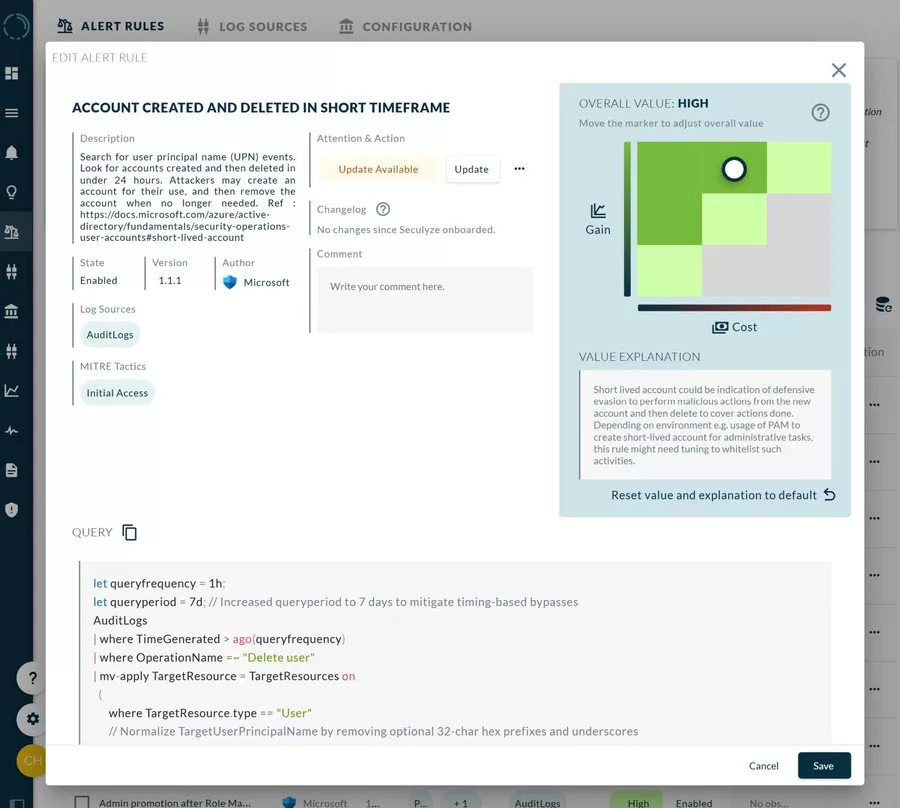
Three details in this view stood out to us:
• You can override the value. You can move the marker on the matrix to adjust the rating for your environment. The built-in value explanation even anticipates this: if your PAM solution creates short-lived admin accounts, this rule may need tuning. A manual override also sticks: Seculyze excludes that rule from automatic re-rating at the next sync, so it keeps the value you set.
• The KQL query is visible in place. You can review the detection logic without switching back to the Microsoft Defender portal.
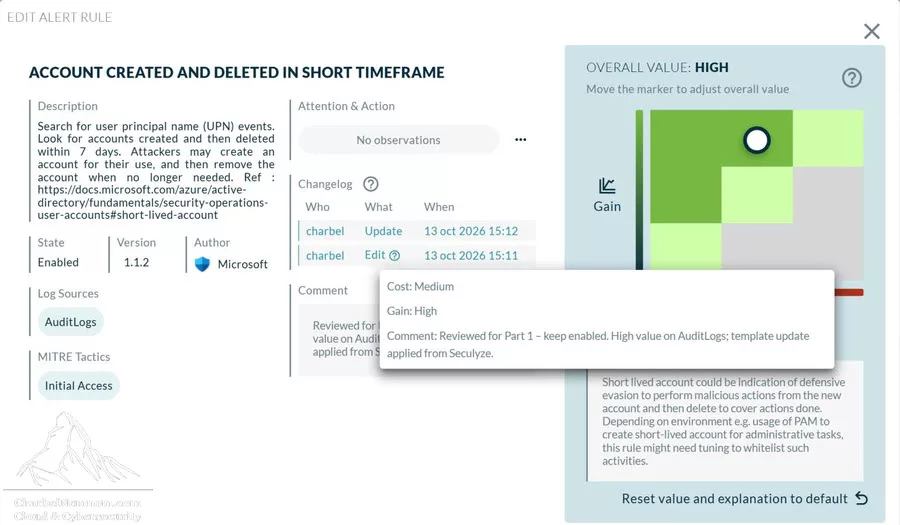
• A built-in changelog. Every change made through Seculyze (state, template updates, value rating, explanation, and comments) is logged with a timestamp and the user who made it. That’s useful for change control and audits. Keep in mind that the changelog is a record, not an undo button: in the standalone edition for enterprise SOC teams, you revert a change in Sentinel. Seculyze for MSSPs can also revert changes directly from the changelog.
The changelog sits in each rule’s details. Every entry shows who made the change, what type of change it was, and when. An Update entry records a template update, and an Edit entry records changes such as the value rating or a comment. Hover over Edit to see exactly what changed, as shown in the figure below. Entries can take a few minutes to appear after you apply a change.
MITRE ATT&CK Coverage
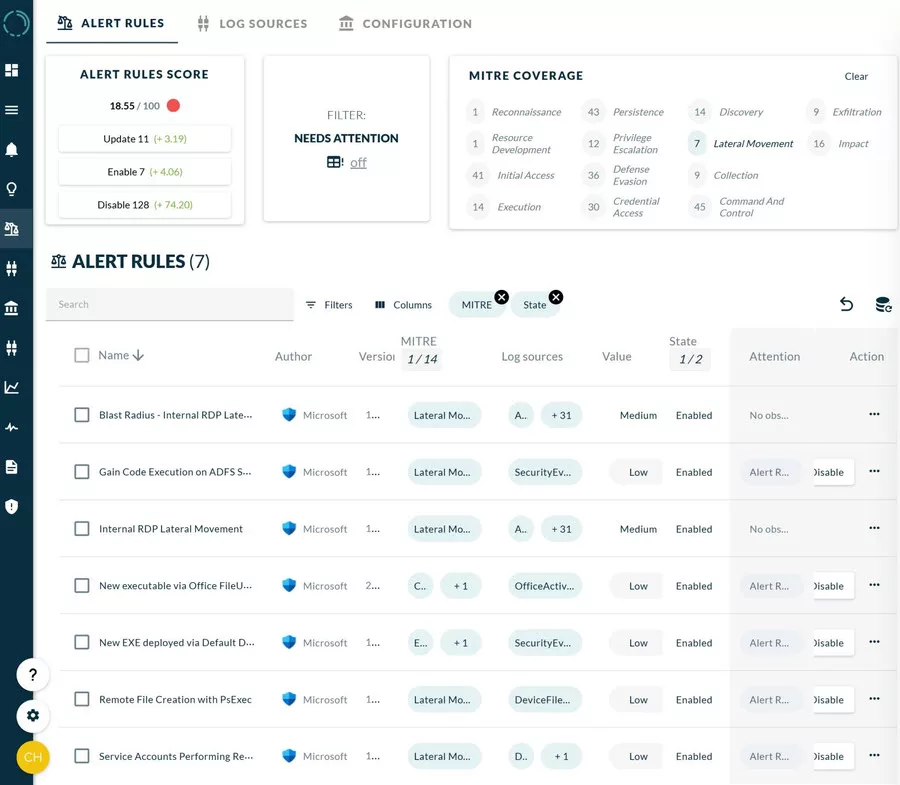
The MITRE coverage panel counts the rules mapped to each tactic. In our environment, coverage is uneven, with most rules mapped to Command and Control (45 rules), Persistence (43), and Initial Access (41), while Reconnaissance and Resource Development have one rule each and Lateral Movement has seven. That’s typical for a Content hub–driven workspace, and it shows where custom detection engineering should focus next. For a technique-level view, you can also generate a MITRE ATT&CK report for your Microsoft Sentinel analytics rules.
Each tactic in the MITRE Coverage panel is clickable. When we clicked Lateral Movement, the list dropped from 217 to the seven rules mapped to that tactic, and Seculyze added two filters: MITRE for the tactic and State set to Enabled, as shown in the figure below. So the numbers in the panel count enabled rules only. To reset the panel, click Clear.
Five of those seven rules are flagged as Alert Rule is Missing Logsource(s), which means they are enabled but have no data to query in our environment. The other two, Internal RDP Lateral Movement and Blast Radius – Internal RDP Lateral Movement, are rated medium value and show No observations.
In other words, the coverage count tells you how many enabled rules are mapped to a tactic, not how many of them can actually detect it. It’s also a quick way to answer a question many SOC teams struggle with: what are we currently blind to?
Balancing Log Sources Against Their Value
The Log Sources view shows every table in the workspace (20 in our environment) with its data volume, cost over the last 30 days, connector, MITRE data source mapping, the number of alert rules that depend on it, and a value rating.
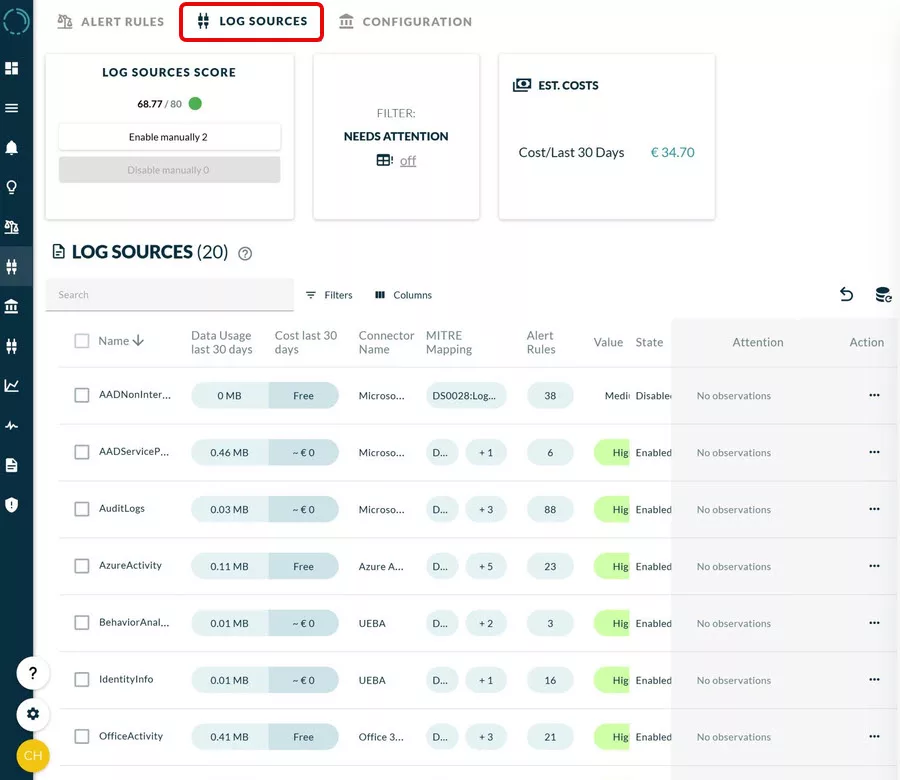
Log source value uses the same cost-versus-gain idea as alert rules. Here, cost is the actual (or estimated) ingestion cost at list price, and gain is the number of alert rules mapped to the table. A table that feeds many detections at low cost is rated high value; an expensive table with few detections is rated low value and is a candidate for savings. Tables in between are rated medium value, based on the same cost-versus-gain calculation.
Our environment showed a clear result here. Before we connected Microsoft 365, the OfficeActivity tables were flagged as High Value Log Source is Disabled. They are free to ingest, and each one has between 7 and 21 analytics rules mapped to it, so connecting them was a quick improvement. After the next sync, the Log Sources score rose from 47.72 to 63.16, and a few days later to 68.77. Two tables, OfficeActivity (SharePoint) and OfficeActivity (Teams), are still flagged because our environment has no SharePoint or Teams activity yet. The same Needs Attention filter is available here: with it on, the list narrows from 20 tables to just those two.
Two things to keep in mind:
- Seculyze doesn’t enable connectors for you. Log source recommendations are marked Enable manually, so you still make the change in Sentinel. We see that as a sensible control, because connectors often need admin consent or licensing decisions.
- Only Microsoft built-in rules count toward a log source’s gain. If your team relies heavily on custom detection rules, some tables may be rated lower than they deserve. Review the rating before you disable a source that your own detections depend on.
The view also shows the estimated 30-day cost (€34.70 in our environment), which links Calibrate to the Cost module that we’ll cover in Part 2.
Checking Workspace Configuration
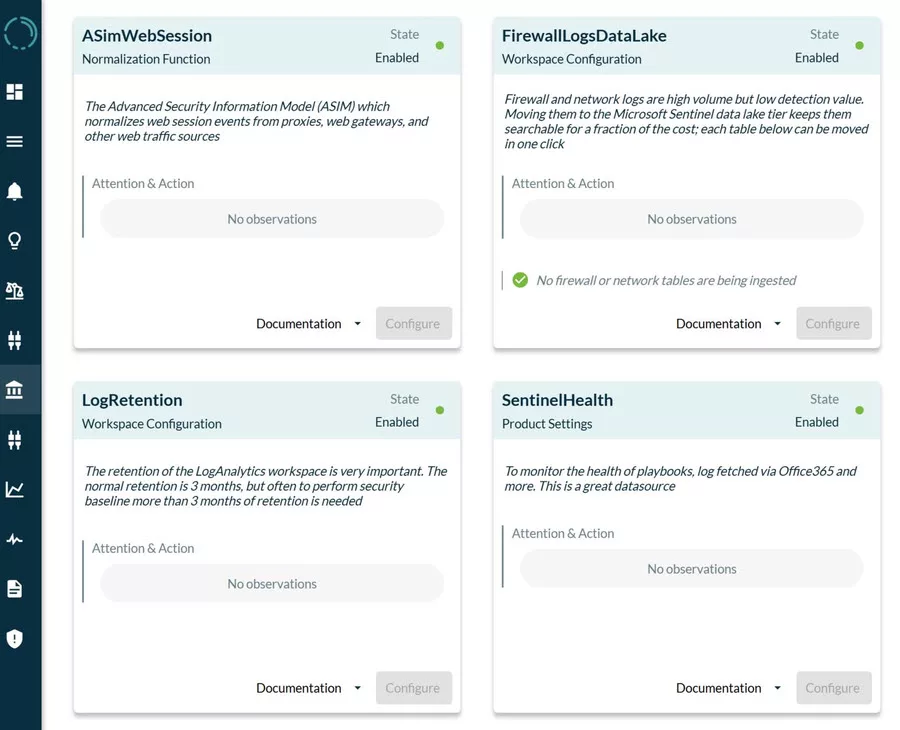
The Configuration view runs 14 checks against workspace and Sentinel settings. Our environment now scores 20 out of 20, with no items left to enable.
The checks fall into four groups:
• ASIM normalization: seven checks confirm that the Advanced Security Information Model parsers for authentication, DNS, file, network session, process, registry, and web session events are available.
• Workspace configuration: log retention and whether high-volume firewall and network tables should move to the Microsoft Sentinel data lake tier.
• Pricing tier: separate checks for the Log Analytics and Sentinel pricing tiers, based on daily ingestion.
• Product settings: UEBA, Sentinel health monitoring, and unhealthy playbooks and data connectors.
The data lake check is a timely addition. Firewall and network logs are high volume and low detection value, and moving them to the data lake tier keeps them searchable for a fraction of the analytics tier cost. Our environment doesn’t ingest firewall logs, so the check passes, but in a production workspace this is often where the biggest savings are.
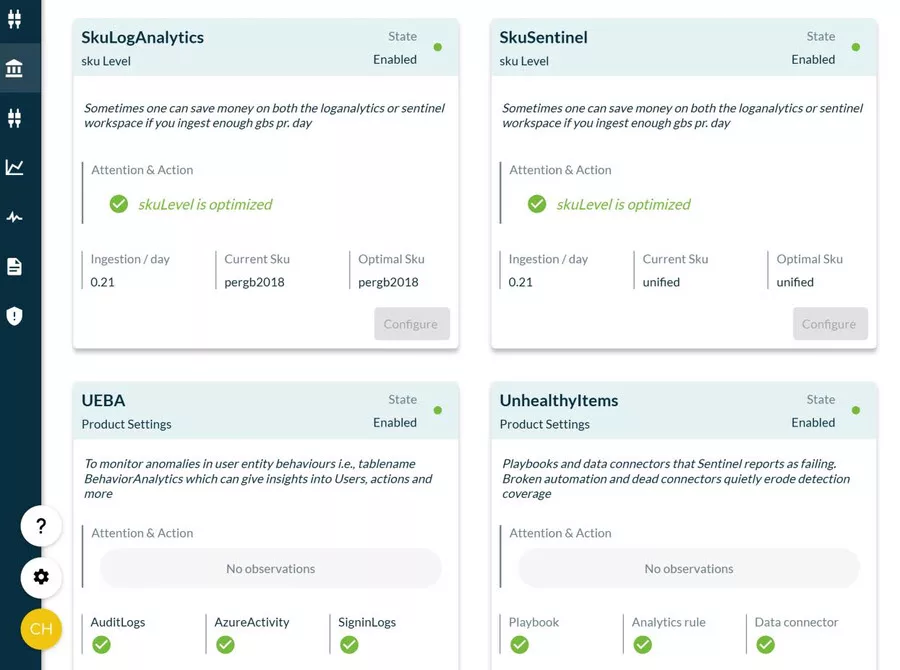
The pricing tier checks confirmed that pay-as-you-go is the right choice at 0.21 GB per day. That’s no surprise for a small environment, but in production these checks are useful, because commitment tiers start at 100 GB per day and many workspaces stay on the wrong tier for months after their ingestion profile changes. We covered the pricing options in detail in Microsoft Sentinel Sizing and Pricing.
The last item we addressed was SentinelHealth. Seculyze flagged it as disabled because no data was reaching the SentinelHealth table, which means auditing and health monitoring for Microsoft Sentinel wasn’t turned on for the workspace. To enable it, configure the diagnostic setting as described in the data connector health section of our Ultimate Health Check for Microsoft Sentinel guide. Seculyze checks SentinelHealth every 24 hours, so the status updates the following day. After we enabled the setting, SentinelHealth switched to Enabled, and the Configuration score reached 20 out of 20.
One thing to watch: the UnhealthyItems check depends on the SentinelHealth table. While that table was missing, the check card still showed No observations. A missing SentinelHealth table also lowers the Configuration score, so the gap shows up in the score even when the card looks clean. Now that SentinelHealth is enabled, the check evaluates playbooks, analytics rules, and data connectors, each with its own status, as shown in the figure below. Until SentinelHealth is enabled, read No observations on this card as not evaluated rather than healthy.
Seculyze Calibrate: Strengths and Limitations
After enabling Seculyze in our environment, here is our honest assessment of the Calibrate module.
What we liked:
- A score you can explain. The Calibrate scoring rules are documented and simple enough to explain to a manager in two minutes, and every recommendation shows the points it adds.
- It rewards removing noise. Disabling low-value rules counts as much as enabling high-value ones, which matches how mature SOCs actually work.
- Outdated templates in one place. Seeing every outdated Content hub rule on one page saves real time.
- Context you can override. The value matrix is a starting point, not a final decision. You can adjust it per rule and document why.
- Changes are tracked. The built-in changelog records who changed what and when.
- Fast feedback. Fixing a gap, like connecting Microsoft 365, shows up in the score after the next sync.
What to watch:
-
- Review bulk recommendations. The bulk Disable recommendation is correct for our environment, but in production you should check whether a missing log source is planned before you disable its rules.
- Custom rules and log source value. Only Microsoft built-in rules count toward a log source’s value, so teams that use many custom rules should review those ratings.
- Sync timing. Most data syncs hourly, but the Log Sources view and SentinelHealth update every 24 hours, and there’s no manual refresh yet. Plan for a delay after you change connectors or permissions.
- “No observations” isn’t always “healthy”. A check card that depends on a missing table, like UnhealthyItems, can show No observations when nothing was evaluated. The score reflects the gap, but the card on its own doesn’t.
- Currency display. The dashboard shows costs in USD while the Log Sources and Cost views use EUR. Seculyze confirmed this is a known issue on their backlog.
In Conclusion
Detection posture in Microsoft Sentinel rarely fails all at once. It degrades gradually: one outdated template, one disconnected log source, and one noisy rule at a time. Seculyze’s Calibrate module makes these issues visible and turns them into a prioritized list of actions, each with a measurable impact on your score.
In our environment, the most valuable findings weren’t unusual. They were 11 outdated rule templates, high-value Microsoft 365 tables that were free to connect, and more than a hundred rules running against data that doesn’t exist. These are exactly the issues that busy SOCs miss, and listing them on one page is the main value of Calibrate.
As a final note, treat the recommendations as expert input, not as actions to apply automatically. The scoring model is transparent, and you can override value ratings, so the tool works best when you combine its view with your knowledge of the environment.
In Part 2, we’ll move from detection quality to cost control: data collection rule transformations, ingestion budgets, and the ingestion anomaly detection that can automatically stop a log source that suddenly ingests far more data than expected.
In Part 3, we’ll turn to tuning. Tuning only lasts when it’s maintained: every exclusion needs an owner and a reason, noisy alerts should be auto-closed with a classification instead of suppressed, so you still have a record to look back at during an investigation, and tuning decisions need a regular review. Otherwise, the tuning belongs to one person rather than the team. If you want a head start, Seculyze published an alert tuning checklist for Microsoft Sentinel that covers these points. Stay tuned!
If you want to see how your own workspace scores, you can request a Seculyze demo.
Frequently Asked Questions
What is the Seculyze Calibrate score?
The Calibrate score rates your Microsoft Sentinel detection posture from 0 to 200. It is split into Alert Rules (50%, up to 100 points), Log Sources (40%, up to 80 points), and Configuration (10%, up to 20 points).
Does Seculyze change my Microsoft Sentinel analytics rules?
Yes, when you apply a recommendation. Changes such as updating, enabling, or disabling a rule are written back to the Sentinel workspace after you confirm them. Seculyze disables rules but never deletes them, and each change is recorded in its changelog. In the standalone edition, you revert a change in Sentinel; Seculyze for MSSPs can also revert changes from the changelog.
Why does Seculyze recommend disabling analytics rules?
Rules that query tables you don’t ingest, or that generate mostly low-value alerts, reduce your posture. Disabling them removes false coverage and noise. Check whether a missing data source is planned before you disable its rules in production.
How does Seculyze determine the value of a log source?
It compares the ingestion cost of the table with the number of Microsoft built-in analytics rules that use it. Low cost with many rules means high value; high cost with few rules means low value.
How often does Seculyze sync with Microsoft Sentinel?
Most data syncs every hour. The Log Sources view and SentinelHealth update every 24 hours, although log source data is also checked every hour for ingestion anomalies. Microsoft Graph permissions are re-checked every few hours.
What permissions does Seculyze need in Microsoft Sentinel?
For read access, Log Analytics Reader and Microsoft Sentinel Reader. To apply recommendations, such as updating, enabling, or disabling analytics rules, and to auto-close incidents, Microsoft Sentinel Contributor. To update DCR transformations or stop ingestion from a log source, the Monitoring Contributor role.
The Microsoft Graph permissions SecurityEvents.Read.All and ThreatHunting.Read.All are needed for the Secure Score and device changes slides in the monthly report, which use Microsoft Defender advanced hunting tables. A read-only mode is also available on request.
Where does Seculyze store data from my Microsoft Sentinel workspace?
In a PostgreSQL database in Seculyze’s own Azure tenant, in the West Europe region by default. Other regions, such as North Europe or Denmark East, are available on request. Data is encrypted at rest, and you can use customer-managed keys.
Remember, you can always support us in developing tools and creating content via Why Contribute? – Charbelnemnom.com Cloud & Cybersecurity
__
Thank you for reading our blog.
Please let us know in the comments section below if you have any questions or feedback.
-Charbel Nemnom-
